Line plots in math is a fun topic to teach 2nd grade students right after your measurement unit. Students just learned about using a ruler to measure objects in inches and centimeters. You can then have them measure different objects, make a line plot, and then talk about the data you see.
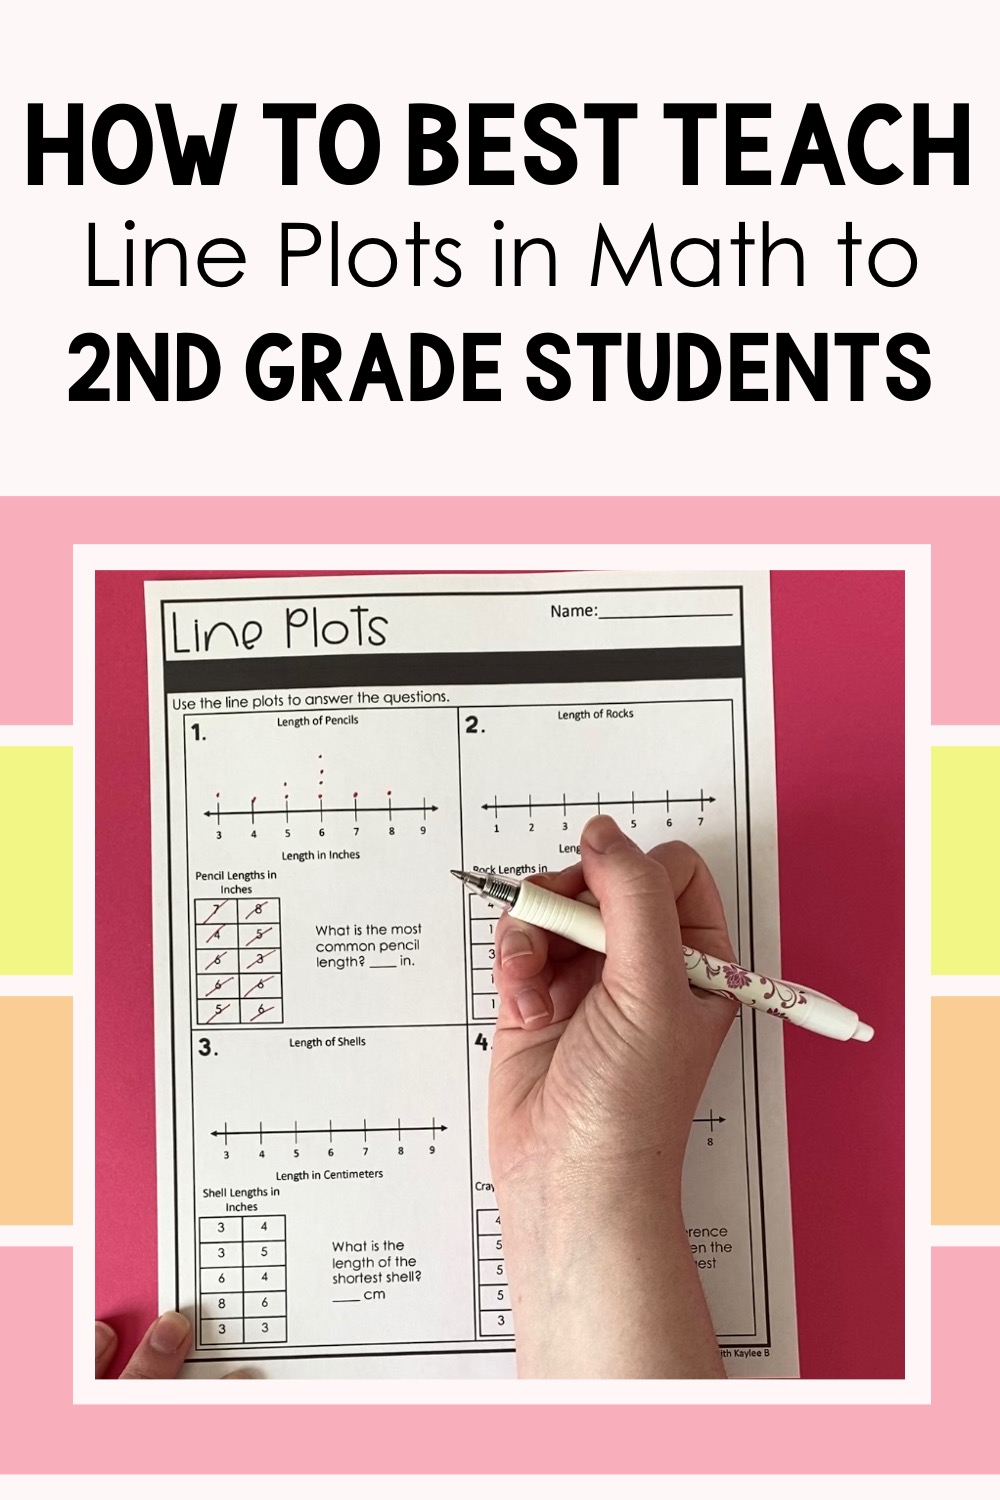
Line plots in math get students real life experience of collecting and organizing data. It’s a fun topic to teach in 2nd grade.
This matches perfectly with the 2nd grade common core state standard for measurement and data. 2.MD.D.9 states, “Generate measurement data by measuring lengths of several objects to the nearest whole unit, or by making repeated measurements of the same object. Show the measurements by making a line plot, where the horizontal scale is marked off in whole-number units.”
When it comes to how to best teach line plots in math to 2nd grade students I like to first introduce what is a line plot in math, show line plot real life examples, and then get my students practice with line plot worksheets and other fun activities.
So let’s get into exactly how I teach line plots in math.
What is a Line Plot in Math
I tell my students that line plots are called line plots because we use a number line to show the data. We use dots above the numbers of the line to show information.
It’s best to show students what you mean by this. I use display pages to guide my direct instruction. These are like slides that walk us through everything and make the lesson more visual for students.
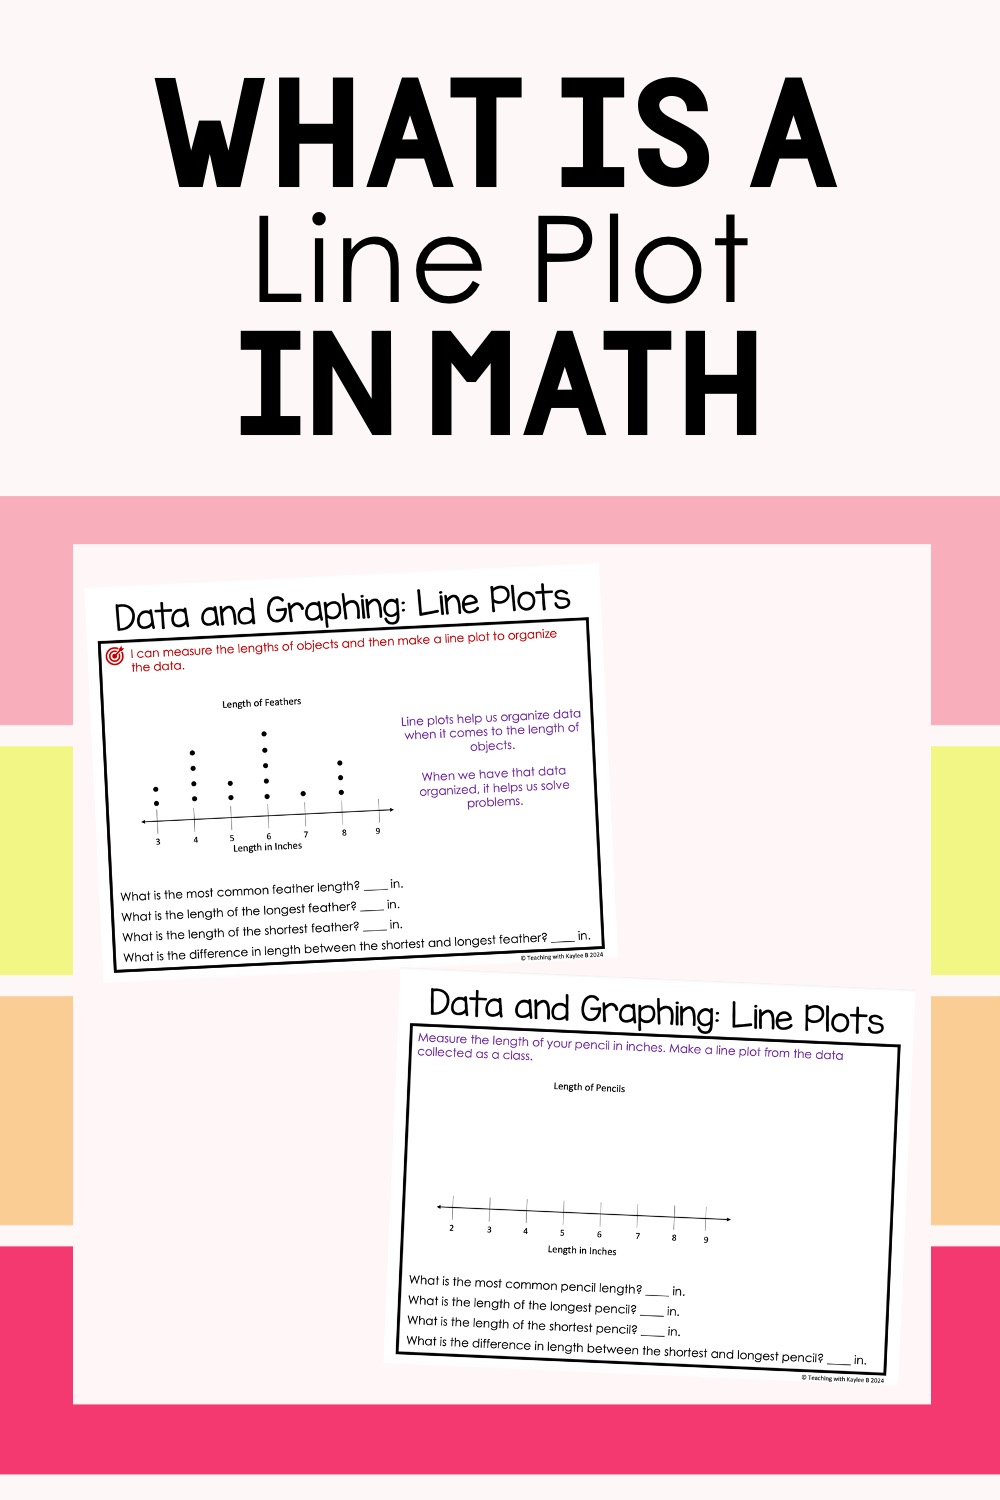
To help explain what is a line plot in math, show these line plot examples to your students.
I show students an example of a line plot that shows the different lengths of feathers. Then I point out the number line, the title, the units, and the dots. Each dot represents a feather. Where that dot is placed on the line plot tells us the length. For example, there are 5 dots above 6. That means 5 different feathers have the length of 6 inches. Then I might ask students what else they notice about the data. It’s fun to see what they come up with!
At this time I also share with my students that line plots help us organize data when it comes to the length of objects. I also share that when we have that data organized, it helps us solve problems.
Together as a class, we use this line plot about lengths of feathers to answer different questions. These questions include what is the most common feather length, what is the length of the longest feather, what is the length of the shortest feather, and what is the difference in length between the shortest and longest feather.
After I have introduced what is a line plot in math, I get my students involved with some line plot real life examples.
Line Plot Real Life Examples
As a class we make a line plot featuring the lengths of our pencils. I hand out a ruler to each student and they measure their pencil to the nearest inch. To learn how I teach measurement to my 2nd grade students, read this blog post here.
After students have measured their pencil, I post up our next display page that has a blank line plot. It has a title that says Length of Pencils and is labeled down below to show that the unit we are working with is inches.
Then I start with 2 inches. I have students raise their hand if their pencil is 2 inches. Students count with me how many of them are raising their hands. I draw that many dots above 2. Then I move on to 3 inches and so on until our line plot is complete.
After that, we use the organized data in the line plot to answer questions. These questions are similar to the ones I mentioned before. We figure out what is the most common pencil length, what is the length of the longest pencil, what is the length of the shortest pencil, and what is the difference between the shortest and longest pencil.
Then we move on to another line plot real life example. This time I have students choose one of their crayons. Students use their ruler to measure the length of their crayon to the nearest centimeter. The next page of our display pages has a blank line plot for the length of crayons.
We fill in our data and answer the questions.
Then I get students their own practice with line plot worksheets and activities.
Line Plot Worksheets
The first line plot worksheet I have my students do has the line plots filled in. They look at that data and answer the questions. The questions are similar to the ones we answered as a class with the display pages so students are well prepared to be successful with these. These are interpreting line plot worksheets. What about making a line plot worksheets?
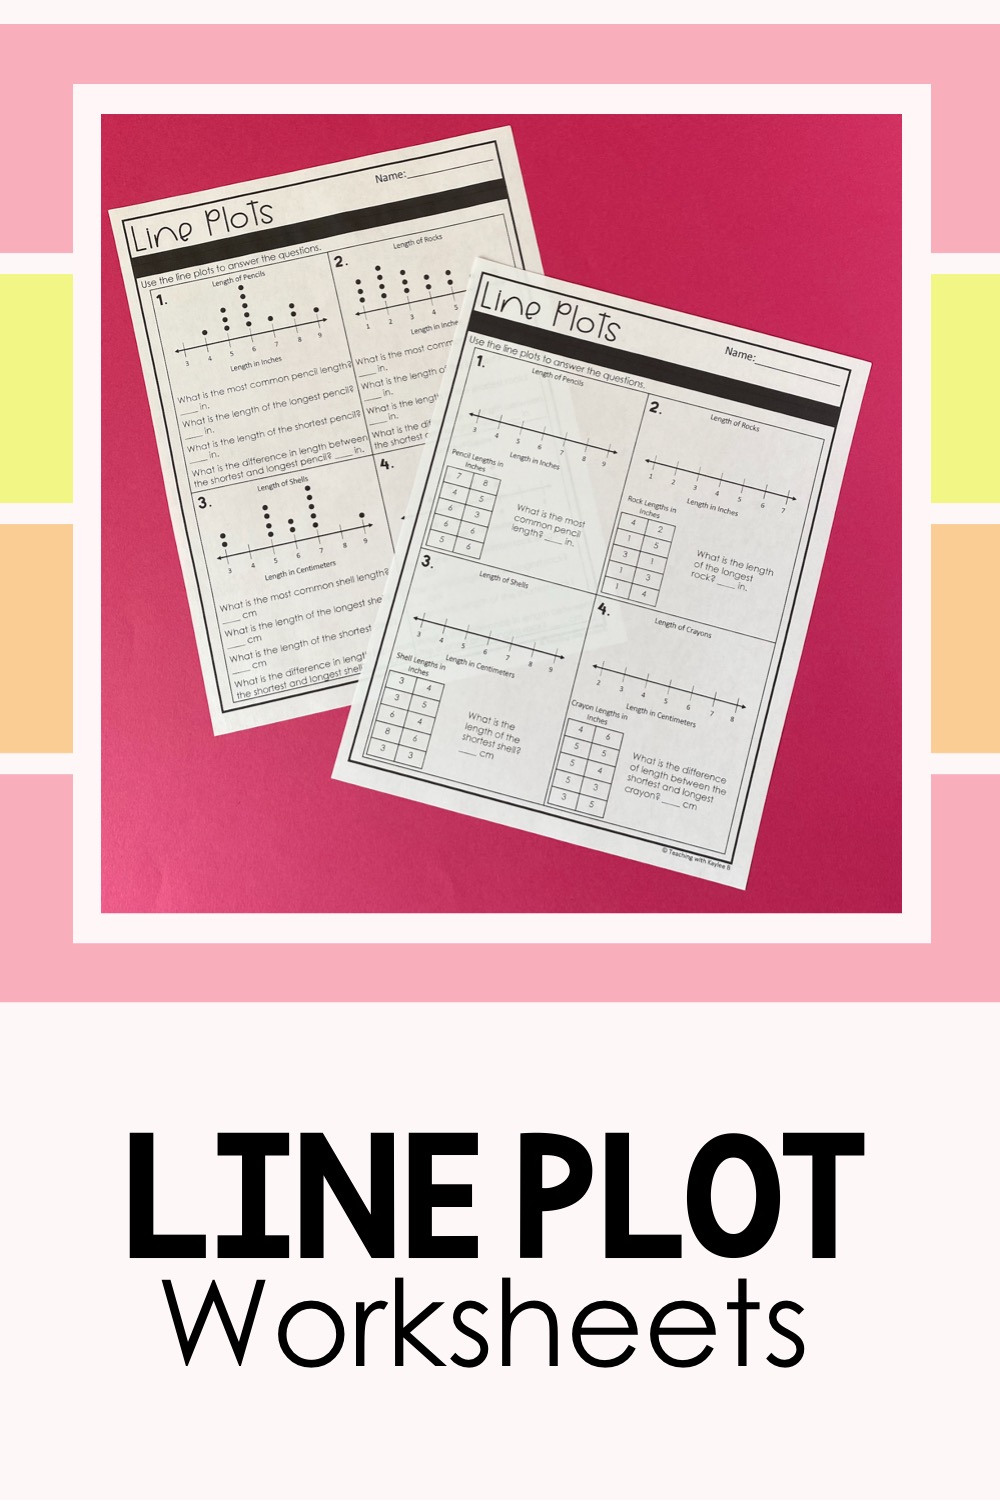
Line plot worksheets are a great way for students to practice working with line plots in math.
I have my students do those too! This time the worksheet has a blank line plot. There is a table with data. Students take the data from the table and fill in the line plot with dots. Then they answer a question about the data.
I like to give my students even more practice with line plots, so I have them complete a line plot scoot activity with a partner.
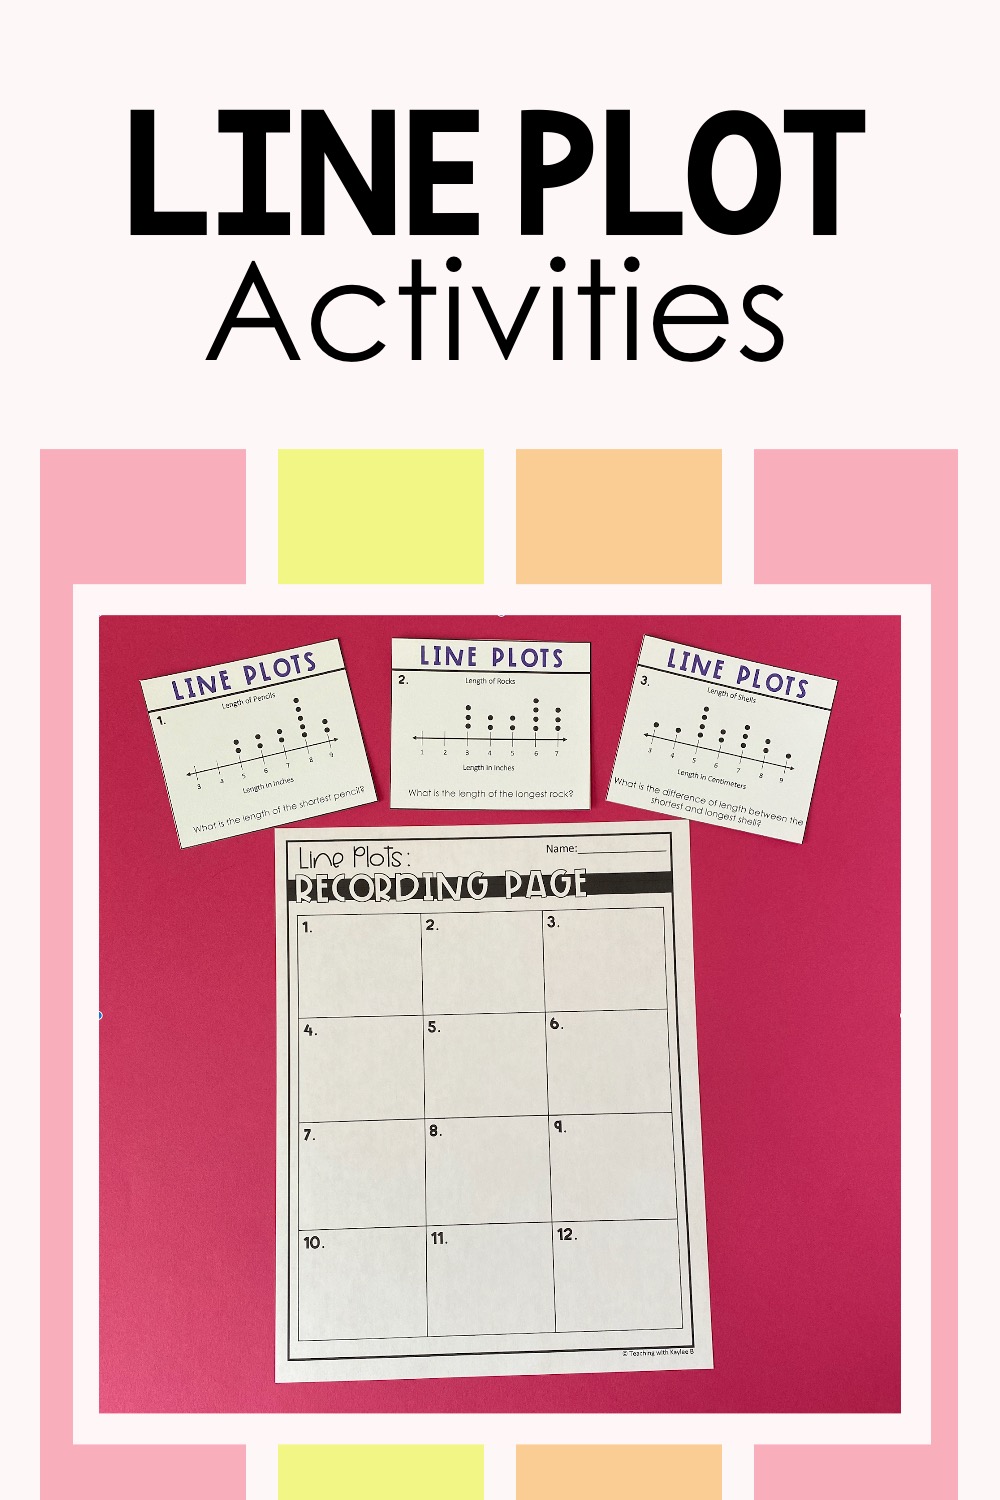
Help students analyze data with these interpreting line plot worksheets.
For this activity, I tape task cards up around our classroom. These task cards have a line plot and a question on them. Students go around to the different task cards, analyze the line plot, and answer the question. They write their answer on their recording sheet and then move onto a different task card.
I like to have students work with a partner because they can support each other and share their reasoning outloud. After students have completed the activity, I have them check their answers with an answer key I have set out. That way they can get immediate feedback.
Then I like to have students do a line plot project. They choose what kind of objects they want to measure. For example, maybe it is different school supplies in your classroom. Students measure those objects and make a line plot. I give them a worksheet with the outline, but they have to write a title and label it with the units. And of course they have to fill in the dots for what they measured. Then this page has a few questions for them to answer about the data they collected.
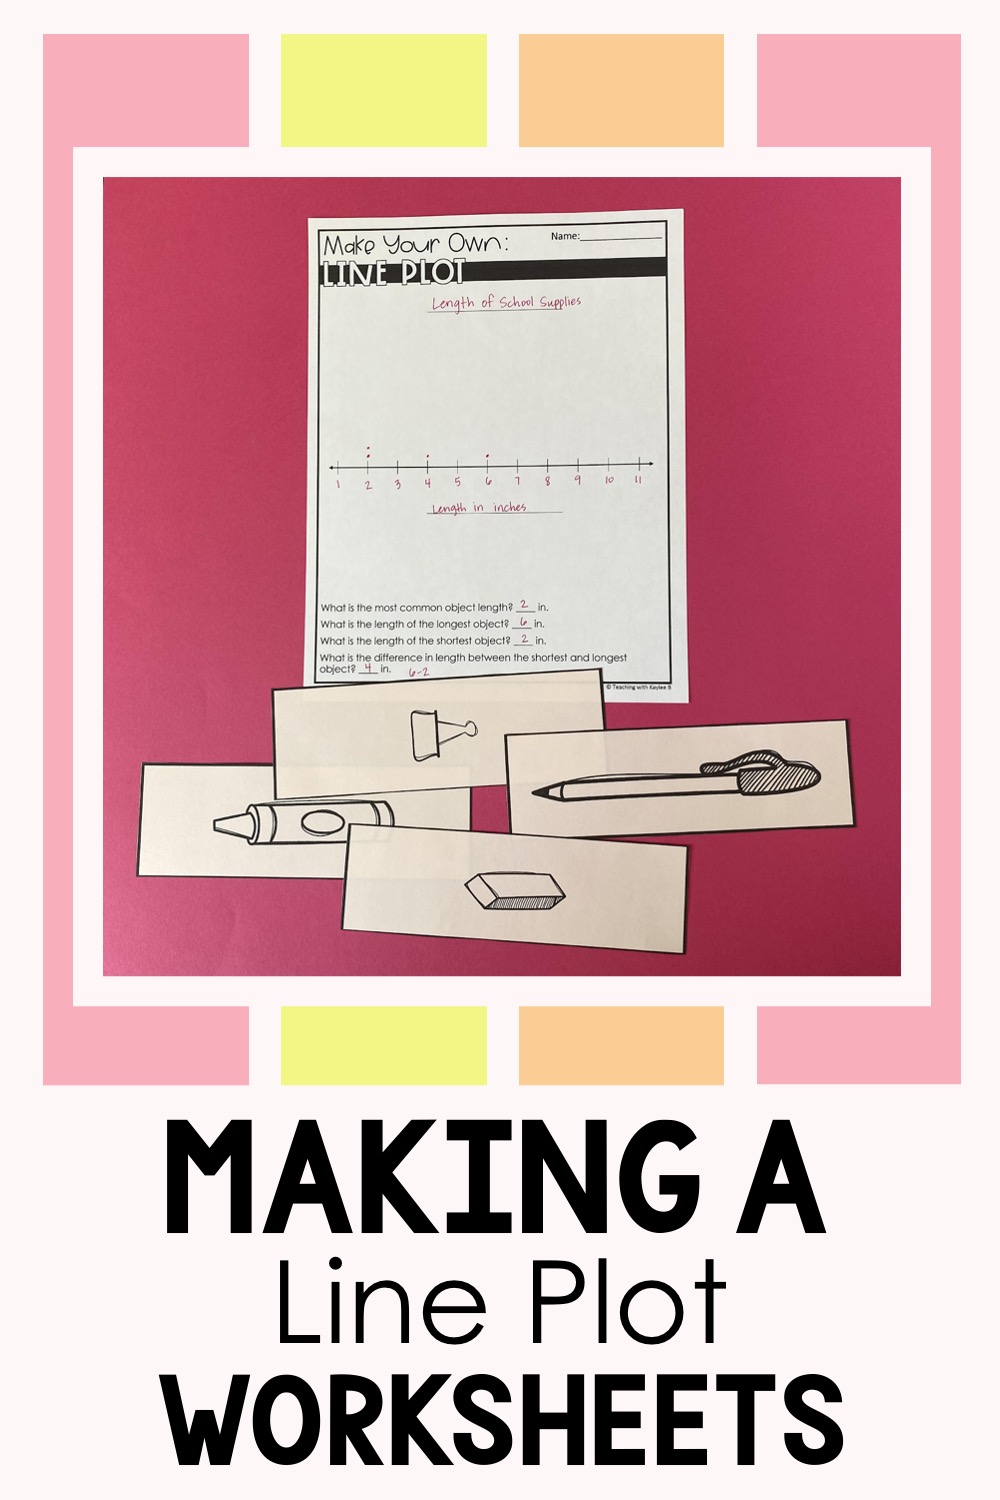
Students love making a line plot worksheets. They allow students to get real life examples of line plots.
If you don’t want your students wandering around the classroom choosing what to measure, you can print out different clipart for your students to measure. I have ones that I print off of different school supplies.
However, it is fun for students to choose different things because then you can have them share with the class about their project. They share what they measured and what their data shows. If you don’t want them to share with the whole class you can have them share their line plots with a small group or with a neighbor.
Finally, I want to check my students’ understanding on line plots in math so I have them complete a little exit ticket. This exit ticket has a line plot and students answer a few questions about the data shown on the line plot. I check these later and take note of who could use more practice during centers.
Line plots are so fun for 2nd grade students because it brings in real life scenarios. They get to measure things, put that data in a line plot, and draw conclusions from analyzing the data.
I hope this blog post has been helpful on how to best teach line plots in math to 2nd grade students. I’ve found it’s best to introduce what is a line plot in math, show line plot real life examples, and then get students plenty of practice with line plot worksheets.
Find all of my line plot teaching materials in this resource here.
This resource also includes materials to teach bar graphs and pictures graphs, making it a perfect resource for teaching all of the data and graphing standards in 2nd grade. Learn more about this resource here.
