Data and graphing is a fun math topic in 2nd grade. Students love the real world aspect to this math. The types of graphs we focus on in 2nd grade math are line plots, bar graphs, and picture graphs.
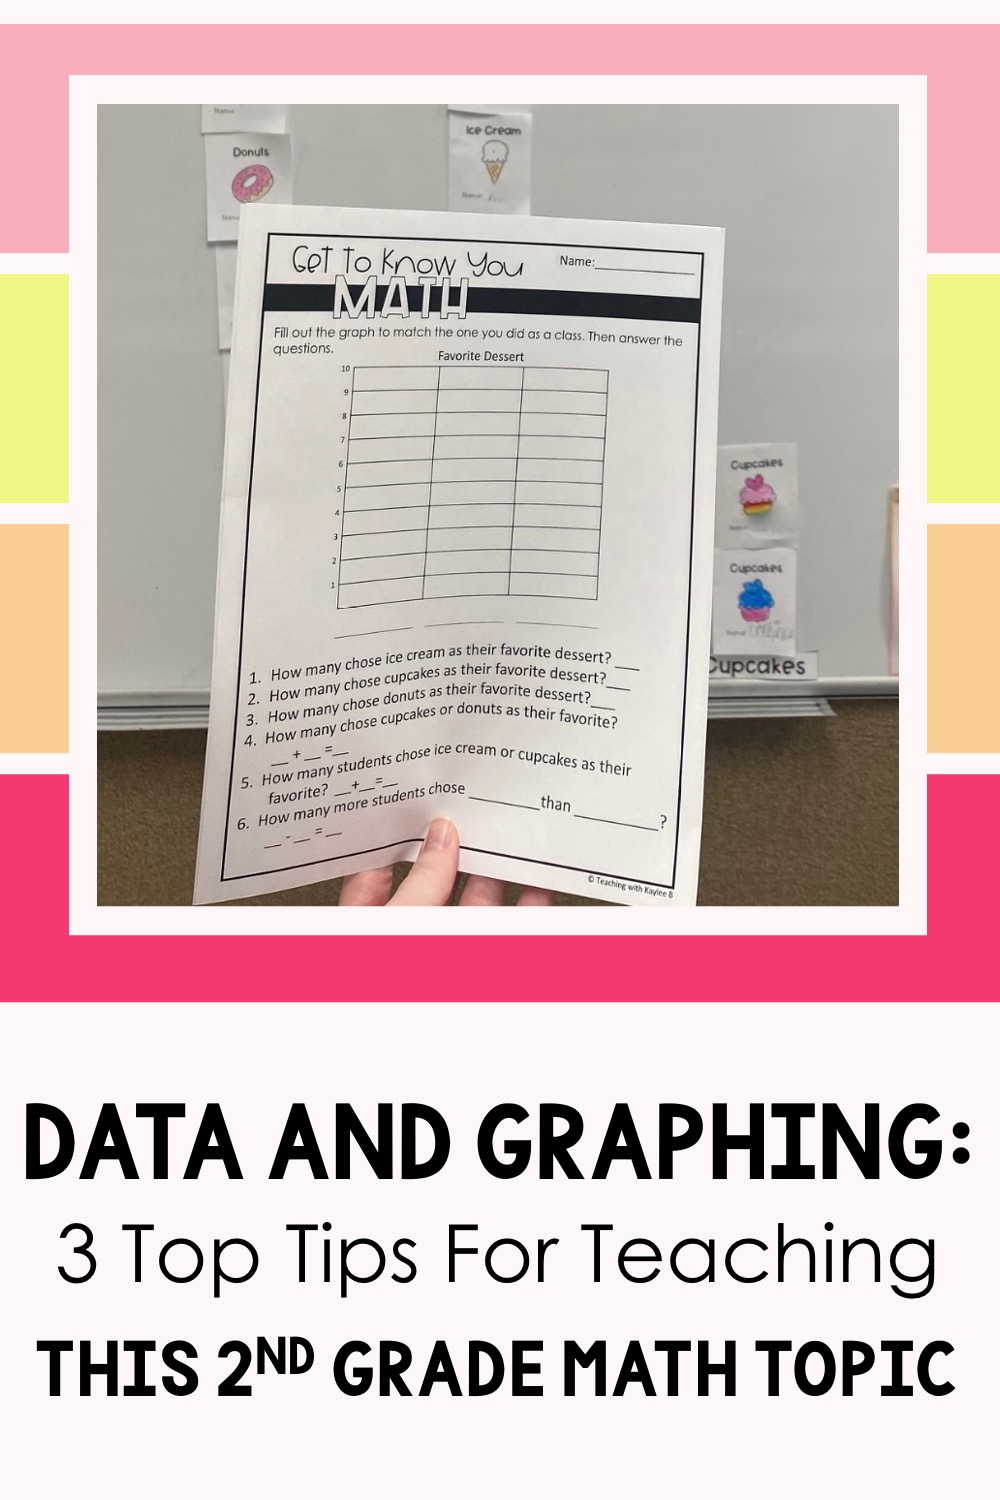
I’m sharing my best tips for teaching data and graphing to 2nd grade students here in this blog post.
With all these types of graphs, what’s the best way to teach data and graphing in 2nd grade?
Well, that’s what we are going to talk about today in this blog post! I’ll be sharing my 3 top tips for teaching data and graphing.
If you want a deep-dive on each of these types of graphs, I have blog posts for each one. Check them out here:
Okay, let’s jump into my 3 best tips.
Data and Graphing
- Show Lots of Examples
My types of graphs lesson plan brings us to our first tip. Show lots of examples. As students see different examples of the types of graphs, it will help them recognize them and why we use each one.
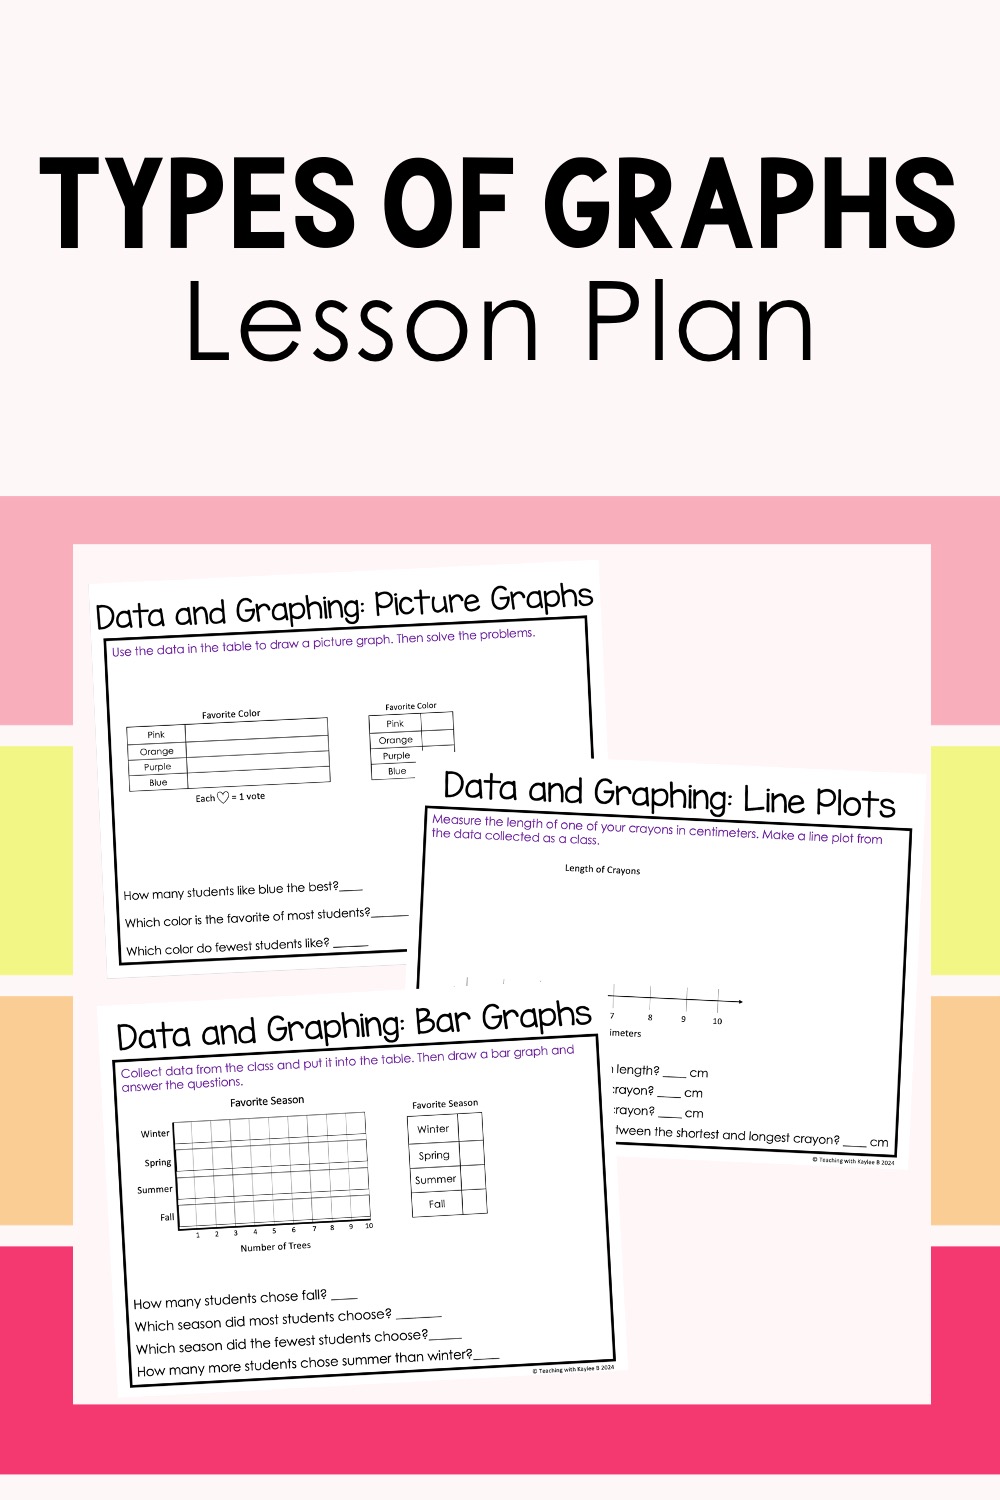
These display pages guide me through my types of graphs lesson plan.
I like to use display pages to show these examples. These are like slides that show examples and they give us practice problems to work together on.
I first show my students a line plot. I have them tell me what they notice about it. They will see a number line and they will see dots. I share with students that line plots are often used when we measure things.
We practice making one together where we measure the length of our pencils. Then we make points on the line plot. Each point represents the measurement of a pencil.
We can easily see which length was the most common. Students can also see what is the shortest length and longest length of all the pencils in class. I ask my students a few more follow up questions that get students looking at and analyzing the data. Then we do another example where students measure the length of a crayon in their crayon box.
The next day we move onto bar graphs. I also show students lots of examples with our display pages. We look at an example of a bar graph of favorite sports. I have students point out what they notice about the graph and then I ask them a few questions about the data.
Then we look at an example with different kinds of trees at the park. This time students have to use the data in a chart to draw the bars in the graph with me. Then I ask them questions about the data. After that, we look at an example where we collect data from the class. We make a bar graph on our favorite season. Students vote and I record the data in a table. Then we draw the bars together.
The next day, I teach a lesson on picture graphs. I first show an example of a picture graph featuring people’s favorite food. I have students share what they notice about this graph. They love that pizza emojis show how many are in each category!
Then I show an example where a class collected cans for a food drive. A tally chart shows how many cans were collected each day. Students help me take that data to make the picture graph. We draw rectangles to represent the cans collected for each day. Then we answer a few questions about the data.
The next example I show them gets them involved in making the data. We make a picture graph on their favorite color. We draw hearts to represent each students’ vote.
Find these display pages to share different data and graphing examples here.
When it comes to data and graphing and teaching all the different types of graphs, you can’t go wrong with showing lots of examples. Share examples of graphs where the data is already filled out. Have students share what they notice about the data. Then get them involved in making the graphs. They take data from a chart and fill out a graph together. After that, get students real world practice by getting them involved in collecting the data.
And that brings me to my next top tip. use your data and graphing lessons to bring in real world math.
Types of Graphs Lesson Plan
- Make it Real World
On the first day of school, I actually do a data and graphing activity with my 2nd graders. I call it Get to Know You Math. We don’t talk about types of graphs or anything like that. I just try to get to know my new students in a fun way that brings in a little math.
I ask them what their favorite subject is. To make it simple, I give them 3 choices: reading, math, or writing. They pick their favorite out of those three and then get a little sheet with a picture that represents that subject. For example reading has a book, math has a calculator, and writing has a piece of lined paper.
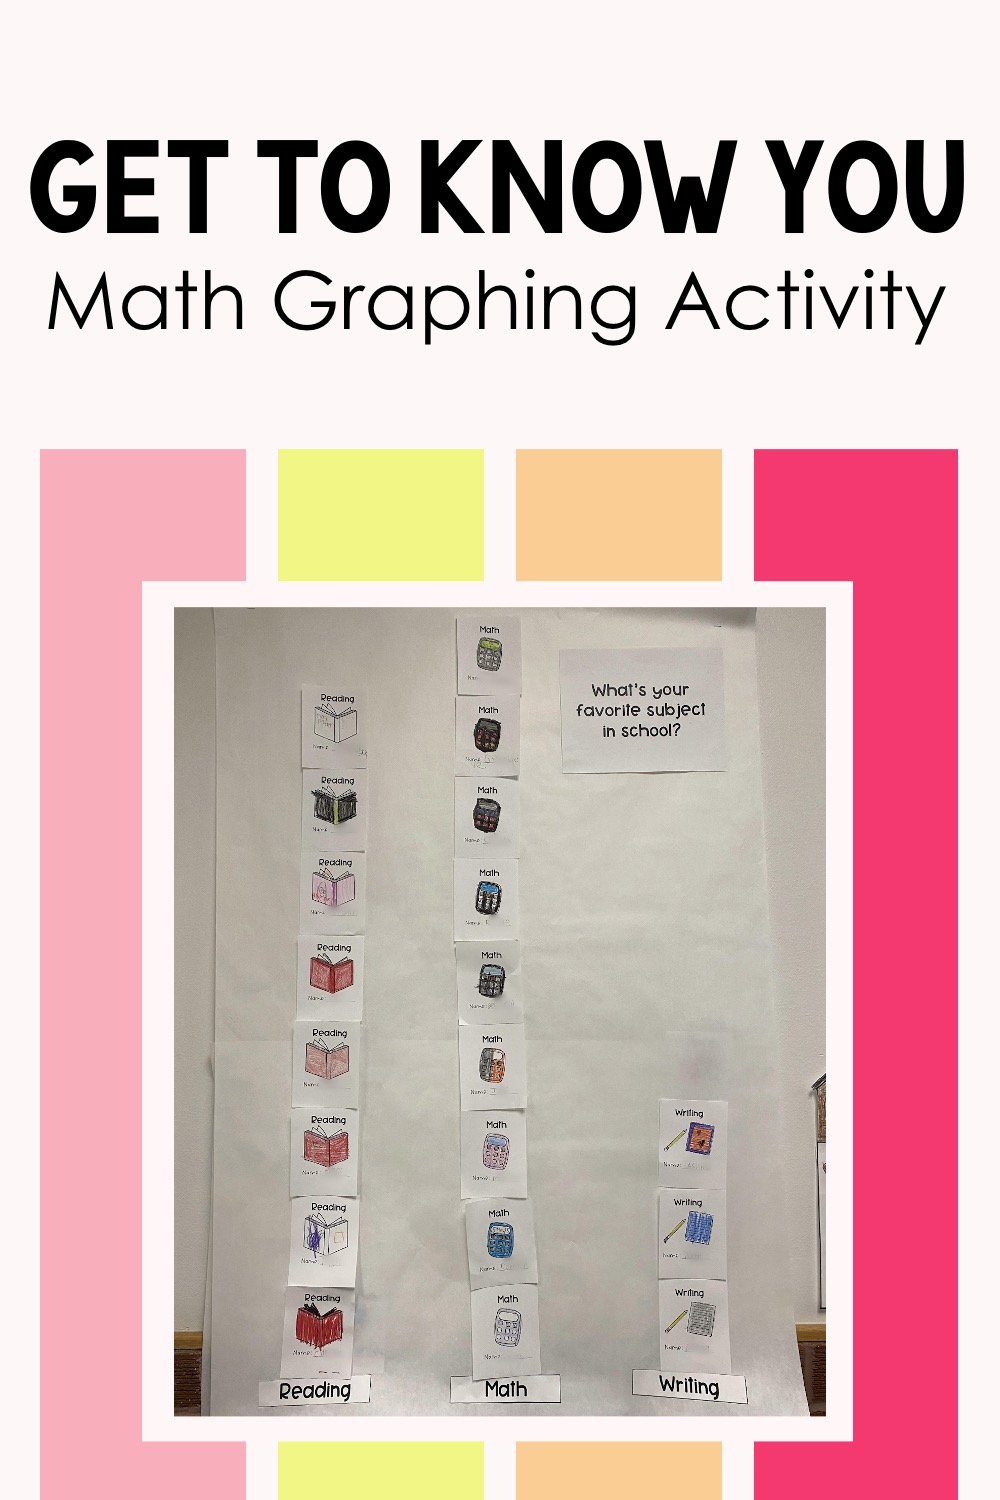
The best types of graphs lesson plan involves real word problems.
On the front white board, I tape up headers for reading, math, and writing. Students decorate their pictures and I help them tape them up in a line above that category. Little do they know… We are making a picture graph!
After they get all taped up, I give students a worksheet that has an outline of a bar graph. I display this worksheet up on the board and together we convert the picture graph into a bar graph.
We also answer a few questions about the data together. This gives me a grasp of where my students are at with solving math facts. It helps me know what math fact strategies to focus on in our first unit of math. Learn more about each math fact strategy I teach in this blog post here.
We do similar activities the rest of the first week of school with students’ favorite dessert and favorite fruit. Find the Get to Know You Math Activity here.
In our actual Data and Graphing unit, I like students to do a real world project for each type of graph.
For line plots, students measure different school supplies and make a line plot. I give them a worksheet that just has the outline. They have to add in the title and different labels. The worksheet even has a few questions students answer about the data they collected.
For bar graphs, I give students a handful of coins and then they make a bar graph on how many quarters, dimes, nickels, and pennies they have. Again, the worksheet just has the outline. Students have to add in the title and labels. I also have a completely blank bar graph worksheet where students can have complete creative control on what data they want to collect. This is a great project to send home and have families do together.
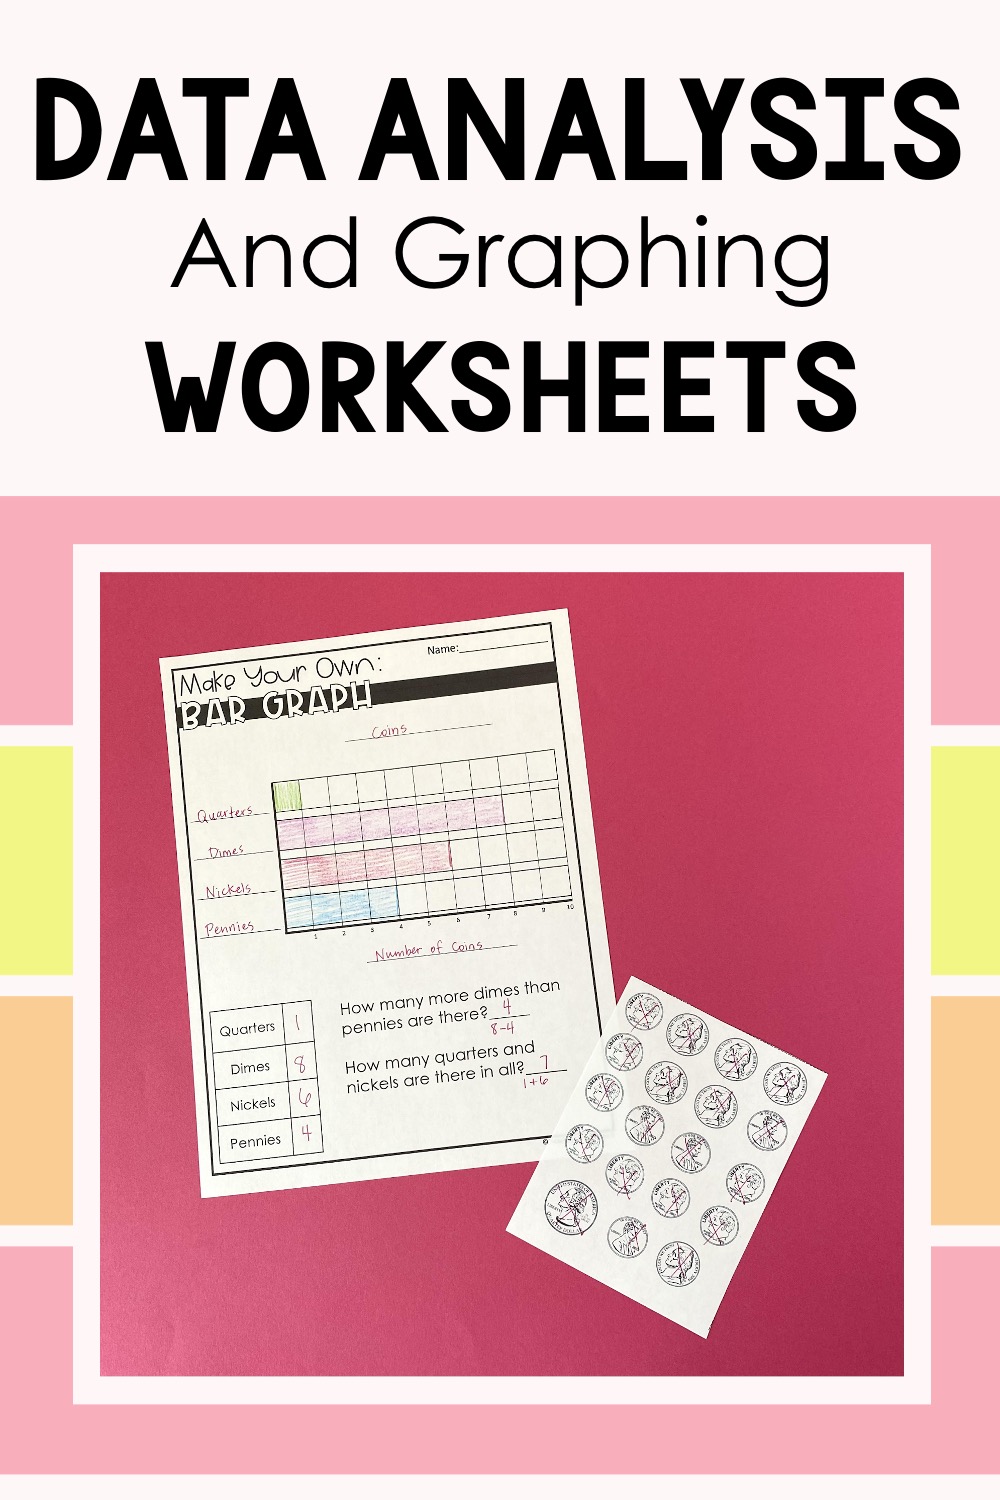
Let students apply the things they’ve learned from your types of graphs lessons with these data analysis and graphing worksheets.
For picture graphs, I give students a handful of buttons and they make a picture graph on the different shapes of the buttons. They add in the title and labels. They even get to choose the picture they want to draw to represent the data. Like the bar graph one, I also have a blank one where students can choose the data they collect.
Find all of these types of graphs projects here.
Another fun way to get students real world practice with data and graphing is to make a large picture graph on your class’s favorite read aloud book from the year. This works out nice because our Data and Graphing unit is at the very end of the school year. So it’s fun to collect the data on all the books we have read together and hang it up in the hallway for the whole school to enjoy.
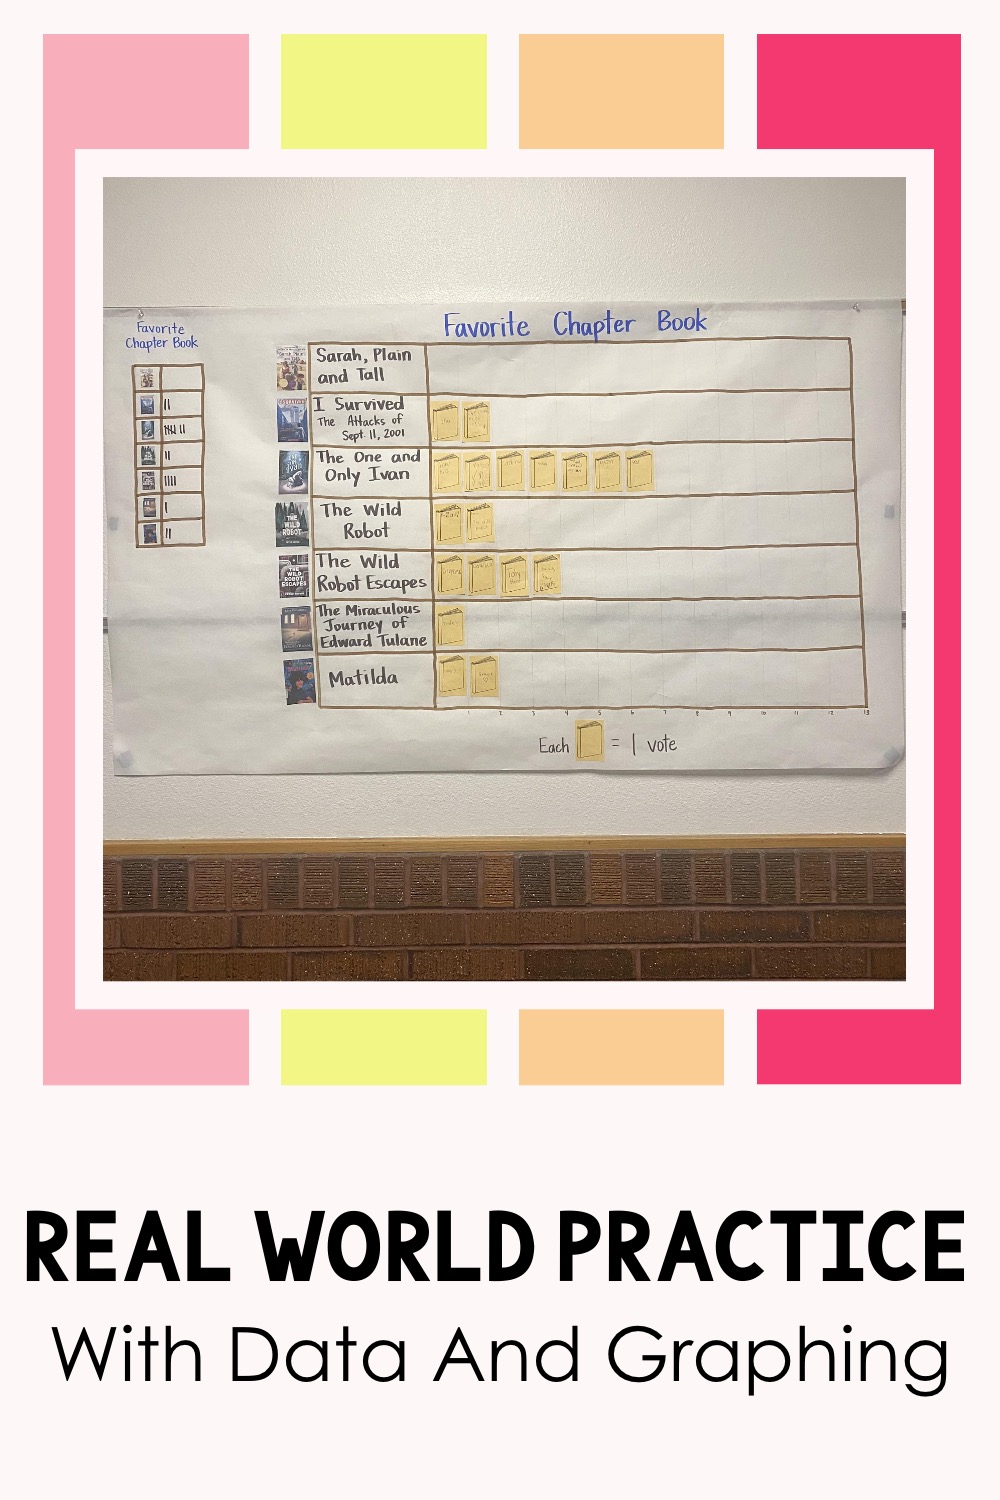
Have your students practice data graph types by making this picture graph about favorite chapter books.
I make this chart with a large piece of butcher paper. I also print out little pictures of the book covers to go with it. This really makes it look nice for the hallway. Students vote on their favorite and we make a little tally chart. Then each student gets a little book clipart. They write their name on the book and we glue it to its matching category on the graph. We write a title and include a key. Then it’s ready to hang up!
Find my list of favorite read alouds for 2nd graders in this blog post here.
For students to really master data graphing, they need lots of practice. And that brings me to my third top tip.
Data and Graphing Worksheets
- Get Students Lots of Practice
After I introduce each type of graph to students and we do a few examples together, I get my students their own practice. I like to do this in a very scaffolded way.
I first start them off with a worksheet where the graphs are already filled out. Students take the information from the graphs and answer questions about them.
The next data and graphing worksheets I give students have them drawing the data in the graphs. These will have some sort of data in a chart and then they fill in the data on the graph outline. Then they answer a few questions about the data shown in the graphs.
I like to get students fun practice where they get up out of their seats and moving, so I have them complete a scoot activity for each type of graph. For these activities, I have students work with a partner. That way they can help and support each other. It also gets them talking things out about the math!
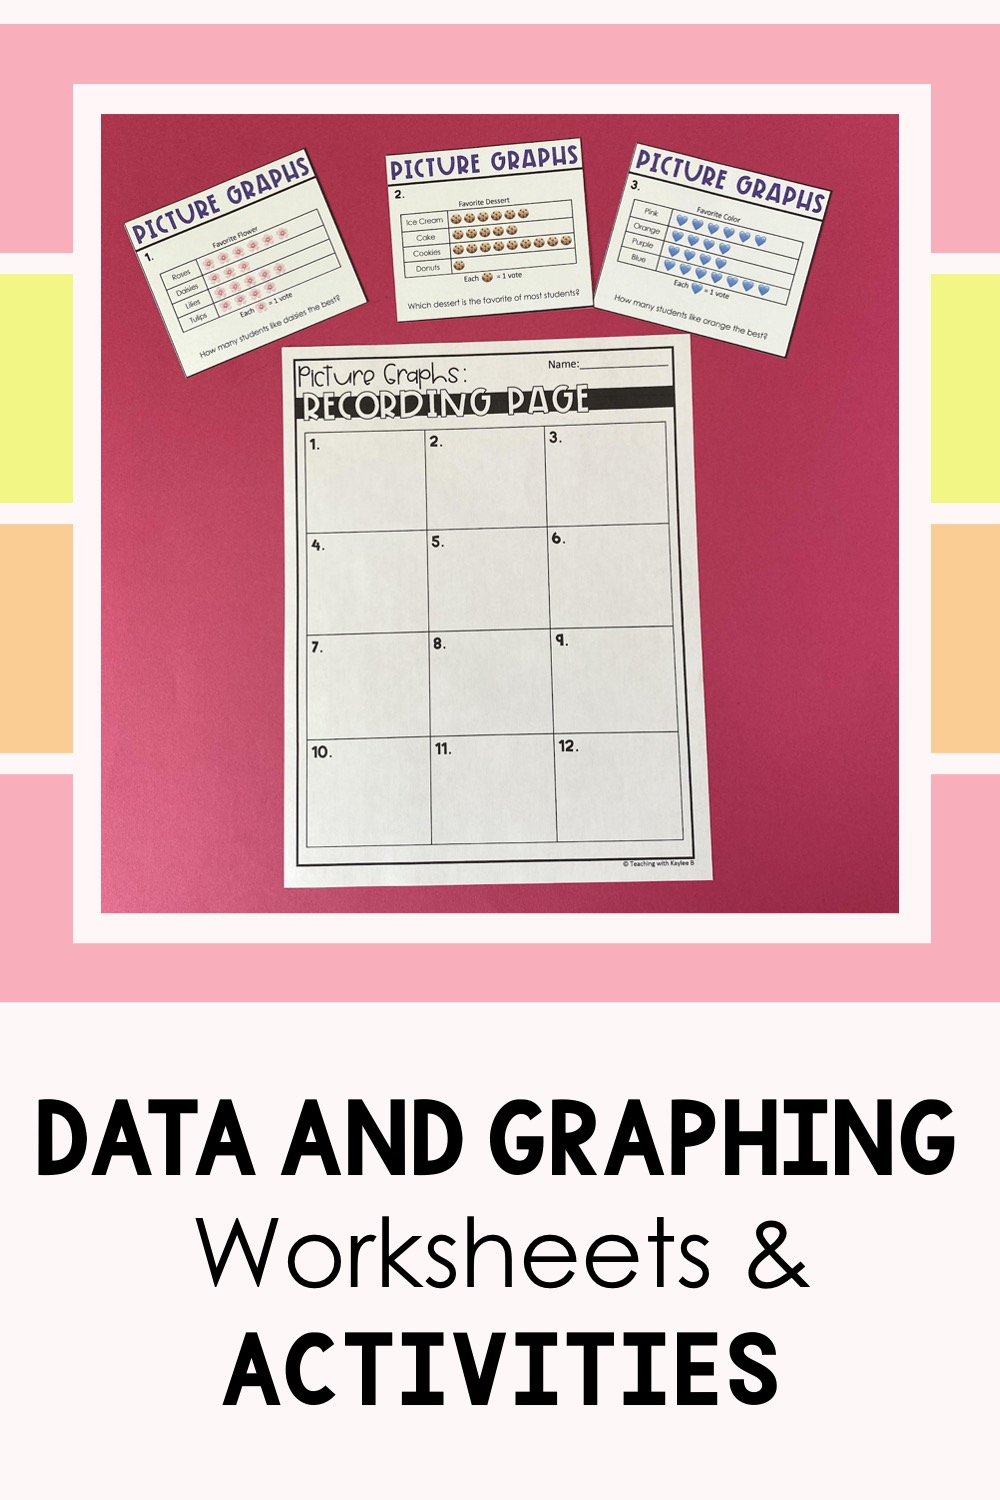
These data and graphing worksheets get students the practice they need to master the different types of graphs.
I have task cards with different graphs on them taped up around the classroom. Students take a recording sheet around to the different task cards and answer the questions about the data shown on the graph.
After students complete this, I usually have them do a real world graph project like I shared before. Then they complete an exit ticket so I can see who has mastered data and graphing and who could use a little more practice during our math centers time.
Find all of my data and graphing activities and resources in this money-saving bundle here. It includes everything you need to teach line plots, bar graphs, and picture graphs. Perfect for 2nd grade students!
I hope this blog post has been helpful on how to improve your data and graphing lessons. It comes down to showing lots of examples, relating it to the real world, and getting your students plenty of practice.
