Bar graphs for 2nd graders are so fun because it is real life math. They are able to collect data and solve problems from what the bar graphs show. Once you learn how to teach bar graphs, your students will be able to draw pictures of bar graphs by using bar graph worksheets and solve simple problems using the information in the bar graph.
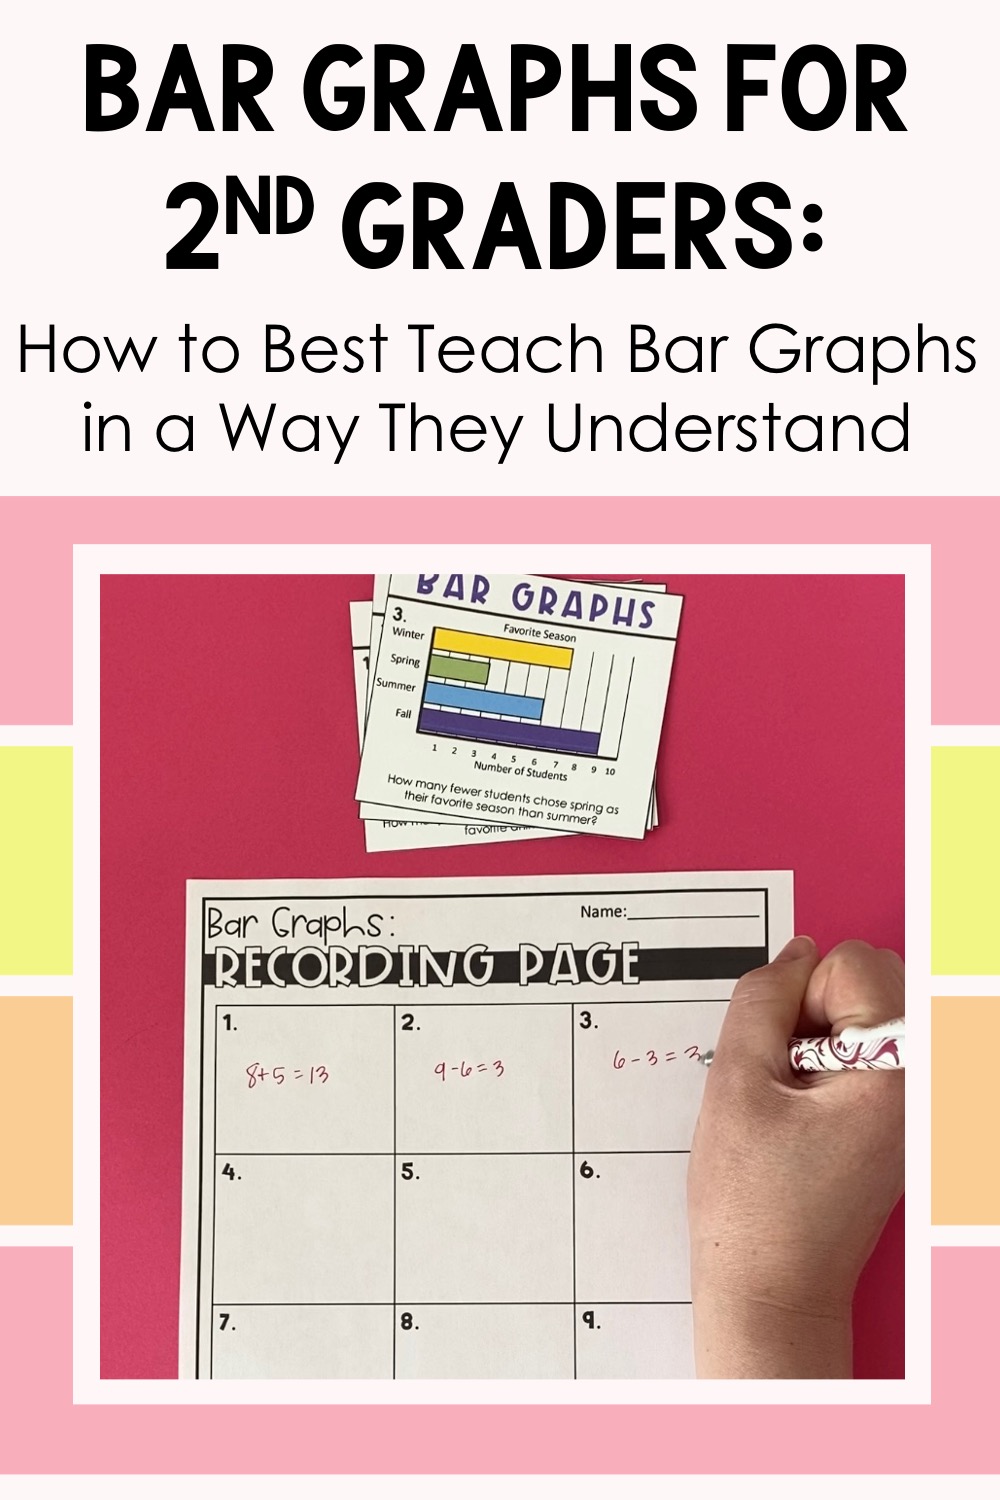
Bar graphs for 2nd graders are fun to teach because it is real world math!
But how do you actually get students to that point?
That’s why I’m writing this blog post today. I’ll be sharing how to teach bar graphs in a way that 2nd graders understand.
Bar Graphs for 2nd Graders
Before we get started on how to teach bar graphs, it’s important to know the 2nd grade standard for bar graphs. The common core state standard 2.MD.D.10 states, “Draw a picture graph and a bar graph (with single-unit scale) to represent a data set with up to four categories. Solve simple put-together, take-apart, and comparison problems using information presented in a bar graph.”
So 2nd grade students need to draw bar graphs and solve problems with the information presented in them.
To teach students how to do this I like to teach what is the bar graph meaning in math, show plenty of bar graph examples, and get students practice with bar graph worksheets.
Bar Graph Meaning In Math
I first want to share with students what a bar graph is. They did work with bar graphs in 1st grade so it is a good review. To show my students a bar graph, I use display pages. These are slides that guide me through our lesson. They help make the lesson visual.
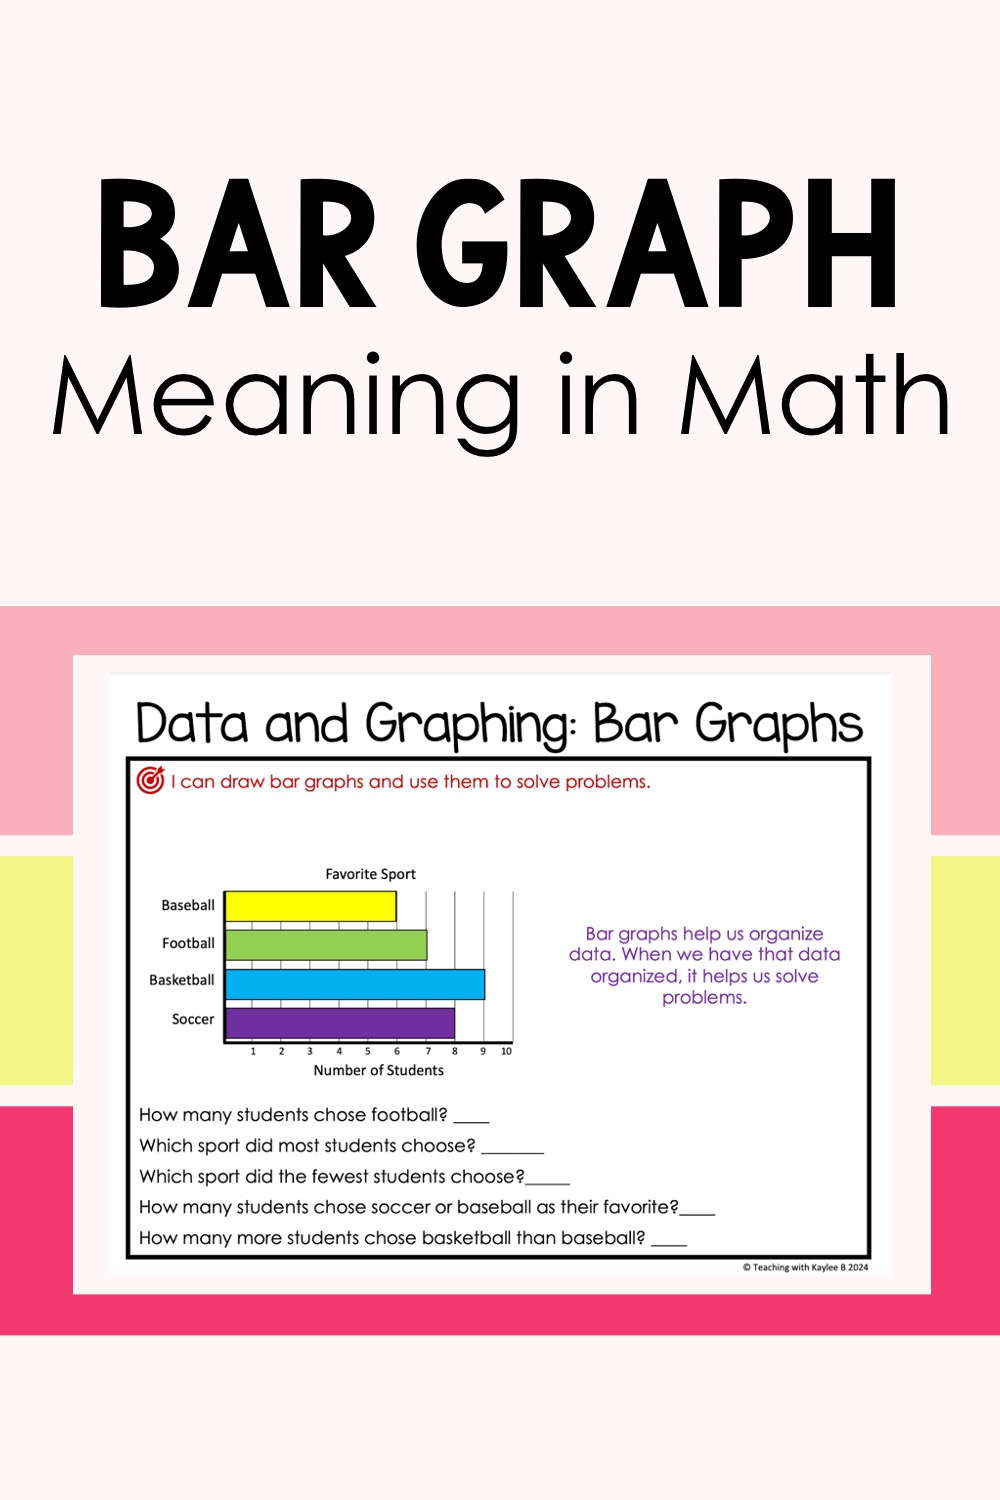
Show 2nd grade students the bar graph meaning in math with this example.
I first display a bar graph that features students’ favorite sports. Then I explain to students that bar graphs help us organize data. When we have that data organized, it helps us solve problems.
I point out that they are called bar graphs because they have bars to represent the data. Where the bar ends is how many there are in that category.
Then I simply ask students what they notice about the bar graph I have displayed up on the board. I have students think to themselves, then they share with a neighbor, and then I call on a few students to share their thoughts with the class.
Here are some things that students could notice. The graph has 4 categories and those categories have different colors. There are numbers on the bottom of the graph. These numbers go up by one. There are labels on the bar graph and a title.
Students could also notice things about the data from the graph. They could see that basketball is the longest bar so it must be the most popular sport. Baseball has the shortest bar so that must be the least favorite sport. Students might see that soccer got one more vote than football.
These are great for students to notice because it helps them solve problems about the data from the bar graph. On that same display page there are questions that I have students solve and answer with me.
These questions include: How many students choose football? Which sport did the most students choose? How many students chose soccer or baseball as their favorite? How many more students chose basketball than baseball? Which sport did the fewest children choose?
After answering those questions together, I like to help students build more understanding by using bar graph real life examples.
Bar Graph Real Life Examples
To show students a real life bar graph example, I have them choose their favorite season and we make a bar graph to represent and organize the data.
Students put their heads down and raise their hand for their favorite season. I like to do this so they are not influenced by their friends on what to vote for. Then I record the data in a table on our display page.
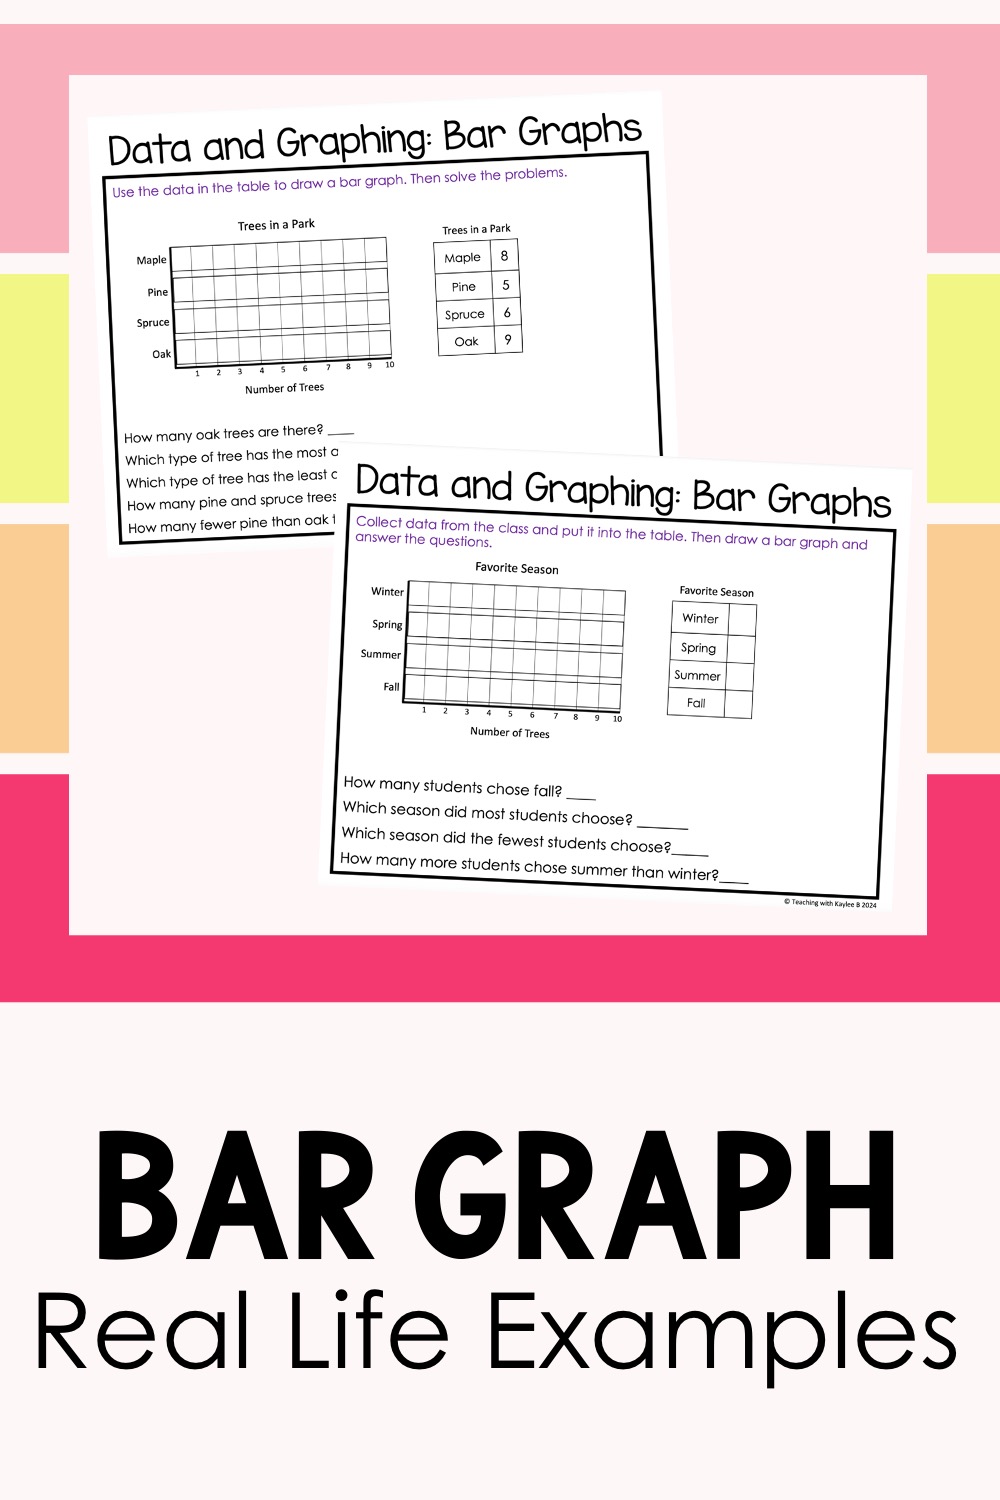
Get 2nd grade students involved in your bar graph lesson with bar graph real life examples.
Then I start with winter and ask students where I should draw the bar. For example, if 5 students said winter was their favorite season, I would put a “stopper line” at 5 and then color in the rest to make a bar. I like to show students the “stopper line” technique because it helps them start their bar at the correct number.
Then we move on to the rest of the seasons and finish making our bar graph. After that, we answer questions about the graph together. We answer how many students’ chose fall as their favorite season, which season did the most students choose, which season did the fewest students choose, and how many more students chose summer than winter.
I like to get students more practice by having them complete bar graph worksheets.
Bar Graph Worksheets
When students are doing bar graph worksheets, I like to provide support and scaffolding. Luckily these worksheets have support built in!
I first start with bar graph worksheets that already have the bar graphs filled out. Students focus on looking at the information on bar graphs and answer the questions.
Then I move students onto bar graph worksheets that have the data in a table and students have to fill in the data to complete the bar graph. After that they answer the questions.
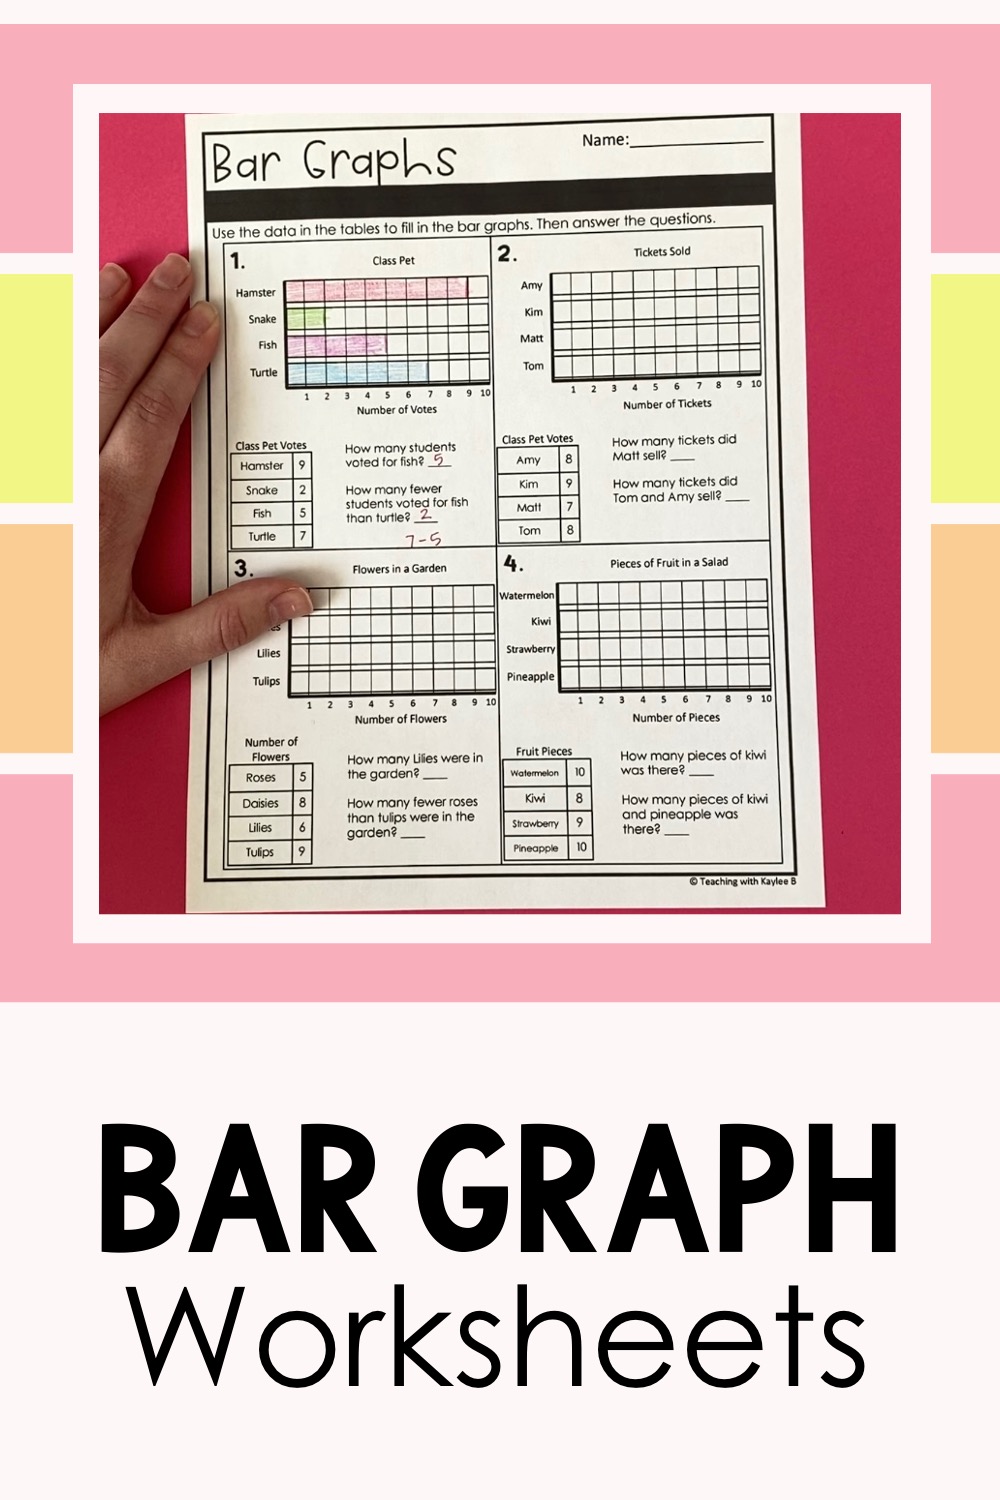
These bar graph worksheets are a great way for students to get the practice they need to master bar graphs.
When students do these worksheets I have them complete the first side of the worksheet on their own as I walk around giving support to students who need it. During this time I take note of common mistakes and misconceptions that I see students have. Then I call students’ attention back and address those common mistakes and misconceptions. I may model a problem or two to help build more understanding.
After that I have students complete the second side of the worksheet by themselves but this time I wait over by our classroom table. Students know if they need help with a problem, they come and sit down at the table. They also know when they finish their worksheet to come line up by the table. I go back and forth from helping students and checking their work with them. This routine is great because it helps me give students immediate feedback on their work. I’m able to help them fix any mistakes right away.
When it comes to bar graphs for 2nd graders, they still need a little more practice. So I have them complete a fun scoot activity with a partner.
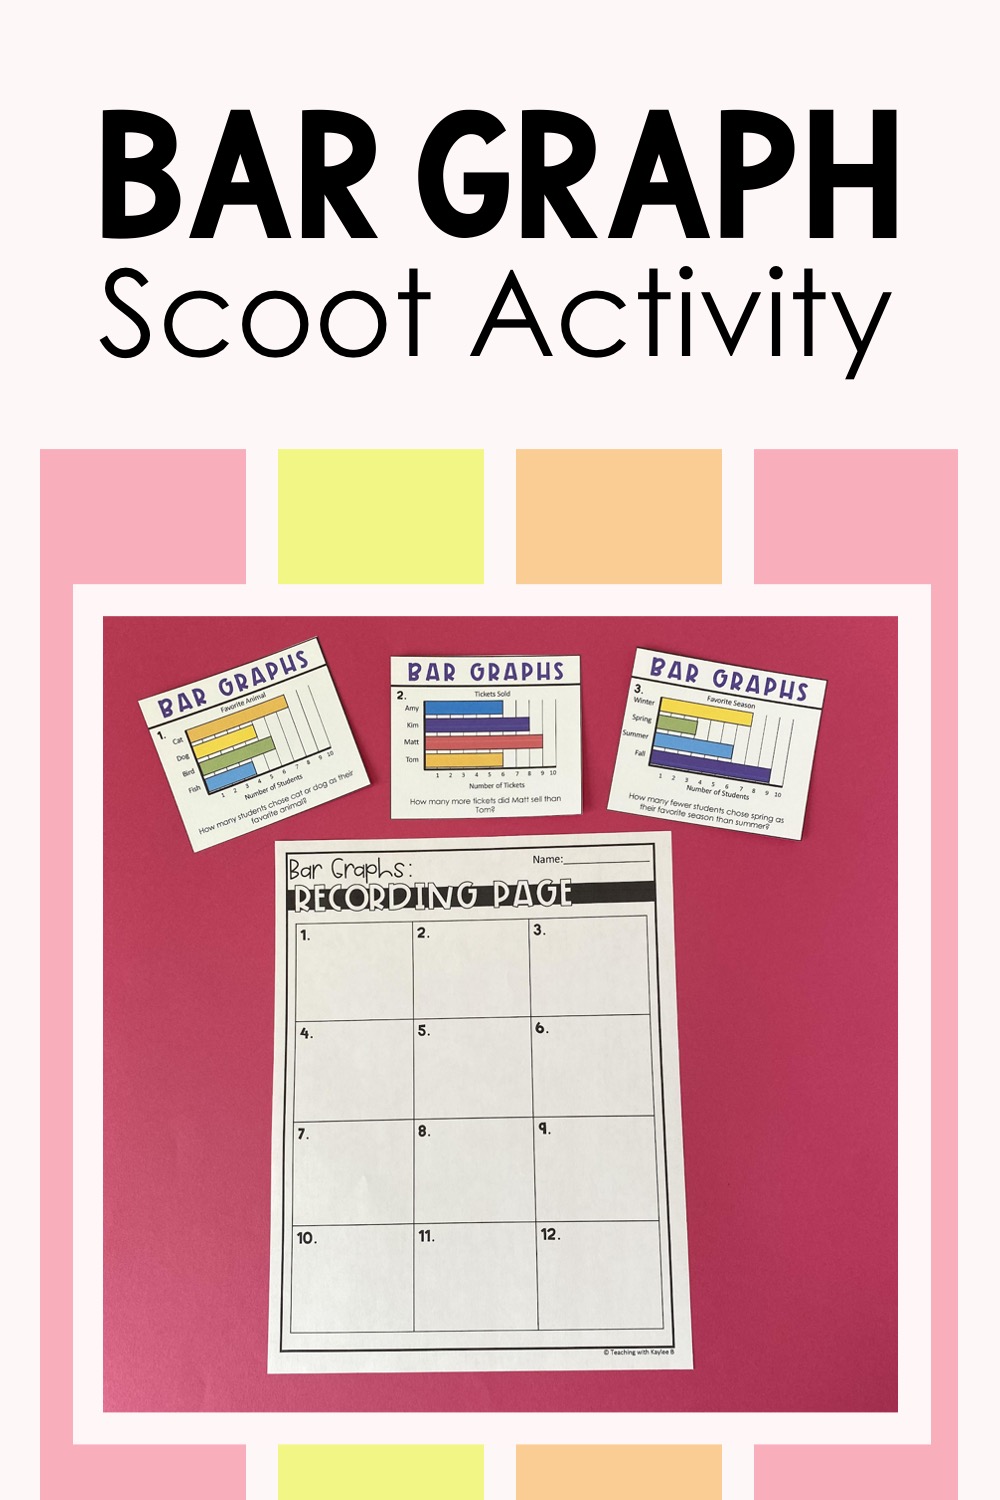
This bar graph activity helps students practice reading and interpreting bar graphs.
For this scoot activity, I tape up different task cards around the classroom. These task cards have a bar graph and a question. Students go around to the different cards and answer the question. Then they record their answers on their recording sheet. I like to set out an answer key so students can check their own work when they are finished.
Then I have students complete a bar graph project. This is really exciting for 2nd graders because they get to make their own bar graph! You can have them completely choose their own topic and gather their own data, or you can have them make their bar graph on different coins. You can give them a handful of coins from your classroom or print out a sheet with different clipart of coins.
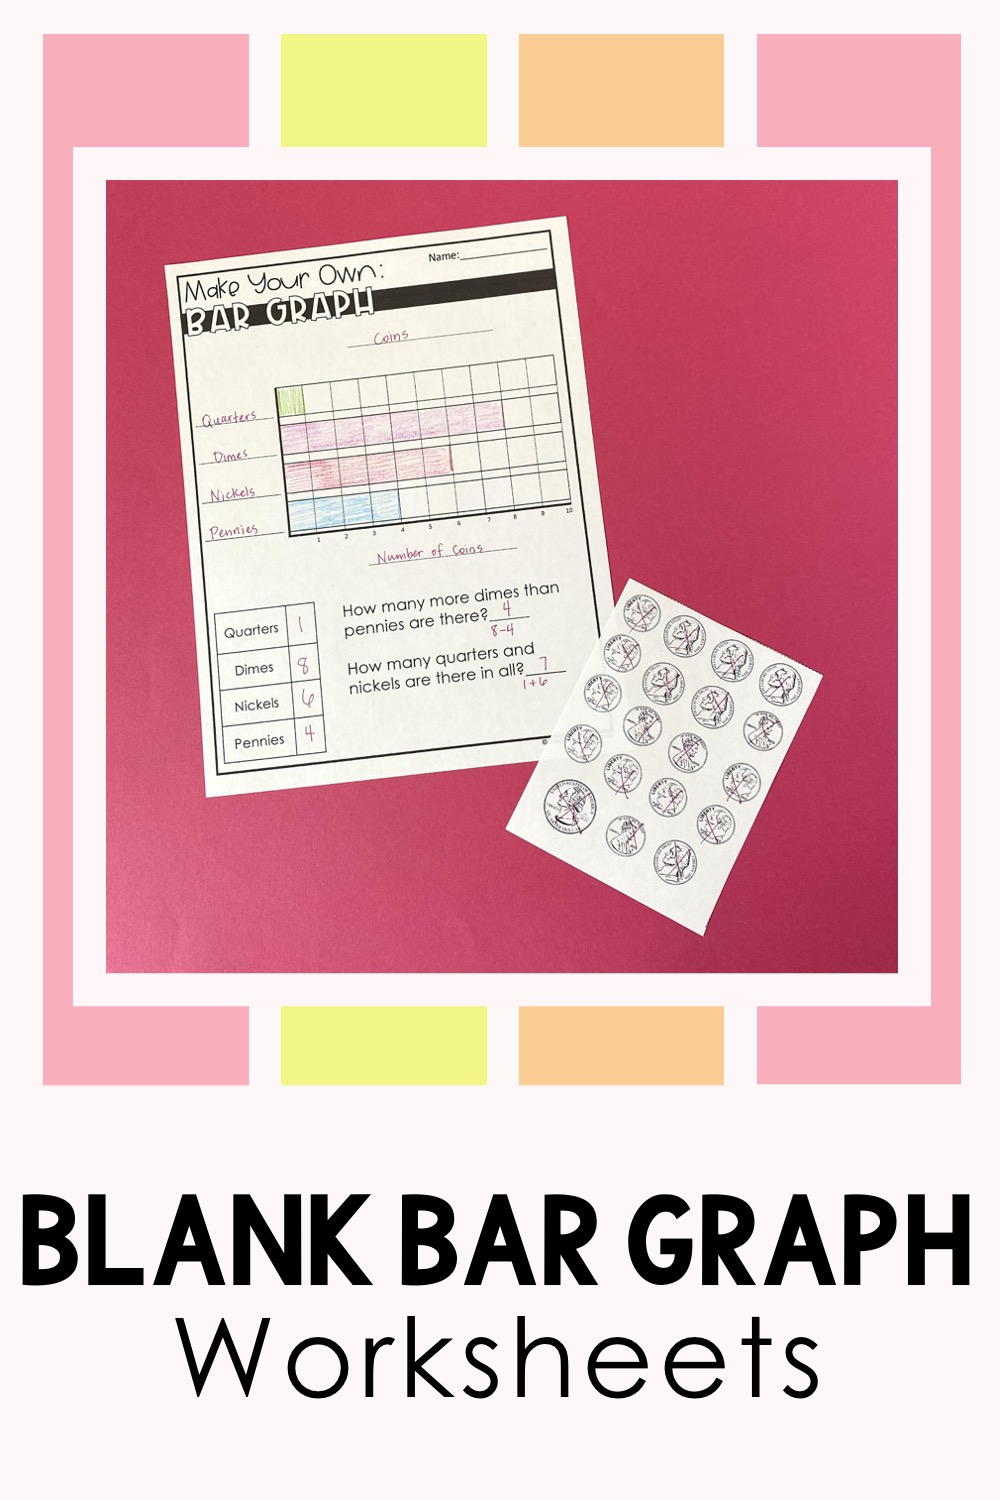
Have students make their own bar graphs with these bar graph worksheets.
Students count up the coins and put the data in a table. Then they label the different categories of the graph and add a title. They draw in the bars and answer the questions. Find the template I use for these drawing bar graph worksheets here.
Finally, I have students do a quick exit ticket to check their understanding on bar graphs. This helps me see who could use more practice during centers.
It’s fun to teach bar graphs for 2nd graders. After you share the bar graph meaning in math you can show them bar graph real life examples. Then get students hands-on practice by having them make their own bar graphs.
Find all of my materials for teaching bar graphs for 2nd graders in this resource here.
I usually teach bar graphs after teaching my students about line plots. Read exactly how I teach line plots in this blog post here.
