Do you ever feel like your students forget key math concepts right after a lesson? Math anchor charts can change that! When used correctly, they help students visualize strategies, reinforce understanding, and serve as an ongoing reference.
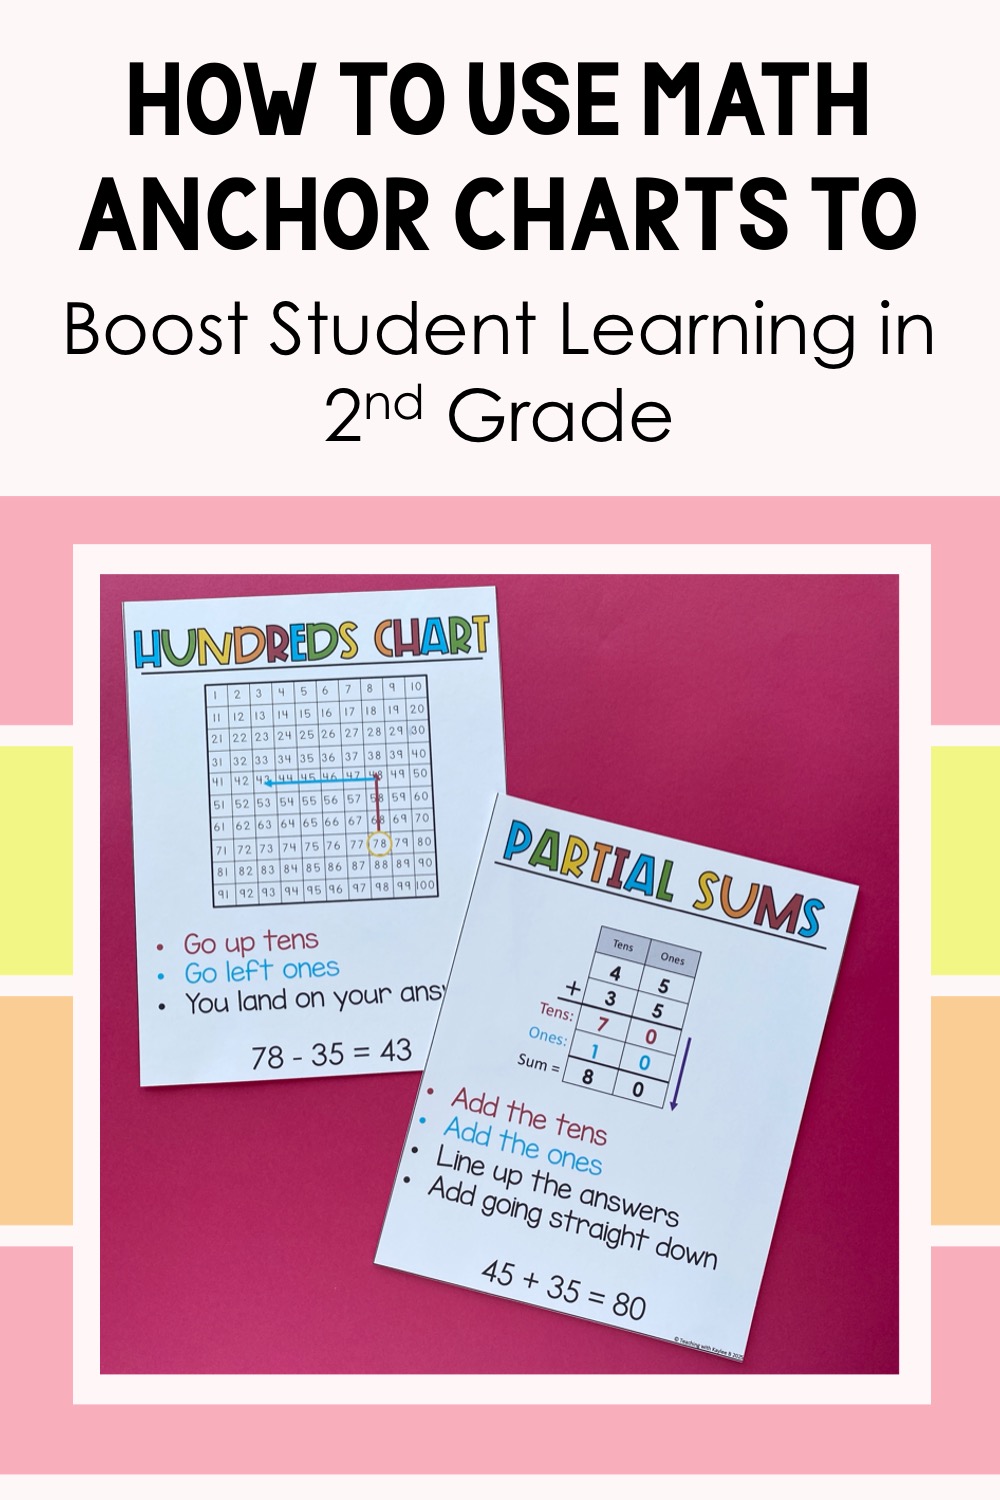
Math anchors charts can be a powerful instruction tool in 2nd grade classrooms.
Whenever I feel like I’m missing something in my lesson, I always turn to math anchor charts to increase my 2nd grade students’ understanding on the topic. Anchor charts can help me in my direct instruction, to review important math concepts, or to have students use them as a reference tool when they are stuck.
There’s a way to use anchor charts in math effectively and a way for them to just be a waste of paper. If you just hang up a bunch of anchor charts on your wall, then they might as well just be posters decorating your classroom. You and your students won’t use them.
But if you use math anchor charts as an instructional tool, then students will better understand the content and will refer to the charts when they are stuck.
So how do you use anchor charts as a way to boost student learning?
That’s exactly what I’ll be sharing in this blog post today. Let’s first get into how anchor charts can be an aide to your direct instruction.
Math Anchor Charts
If you don’t want your anchor charts to be just posters, then it’s important to make the anchor charts with your students.
How do I do this?
I get an outline of the anchor chart all written out beforehand. For our math lessons, I always start students out back at our gathering place for our classroom. Here I have our Math Wall Bulletin Board and a whiteboard easel. I use magnets to post up the chart paper with the outline.
To help me with my outlines, I have printable anchor charts that I refer to when making it. It takes out the hard part of designing the anchor chart on the spot. Want to make creating anchor charts easier? Find all of my 2nd grade printable math anchor charts here.
As part of direct instruction, I’ll model and write the content on the anchor charts. Students are seeing me make it in real time. I’ll get them involved by asking questions. By doing this, students are connected to the anchor chart. They saw it being made and was a part of the process. This makes it more likely for students to refer to it when they need help.
Wondering what I actually put on these math anchor charts? Let’s look at some anchor chart examples.
Anchor Chart Examples
Anchor charts about place value do really well for direct instruction. I have a chart for all the forms of a number. In the middle of the chart paper, I draw a hundreds, tens, and ones chart. Then I split the rest of the chart into 4 sections for standard form, expanded form, word form, and the model.
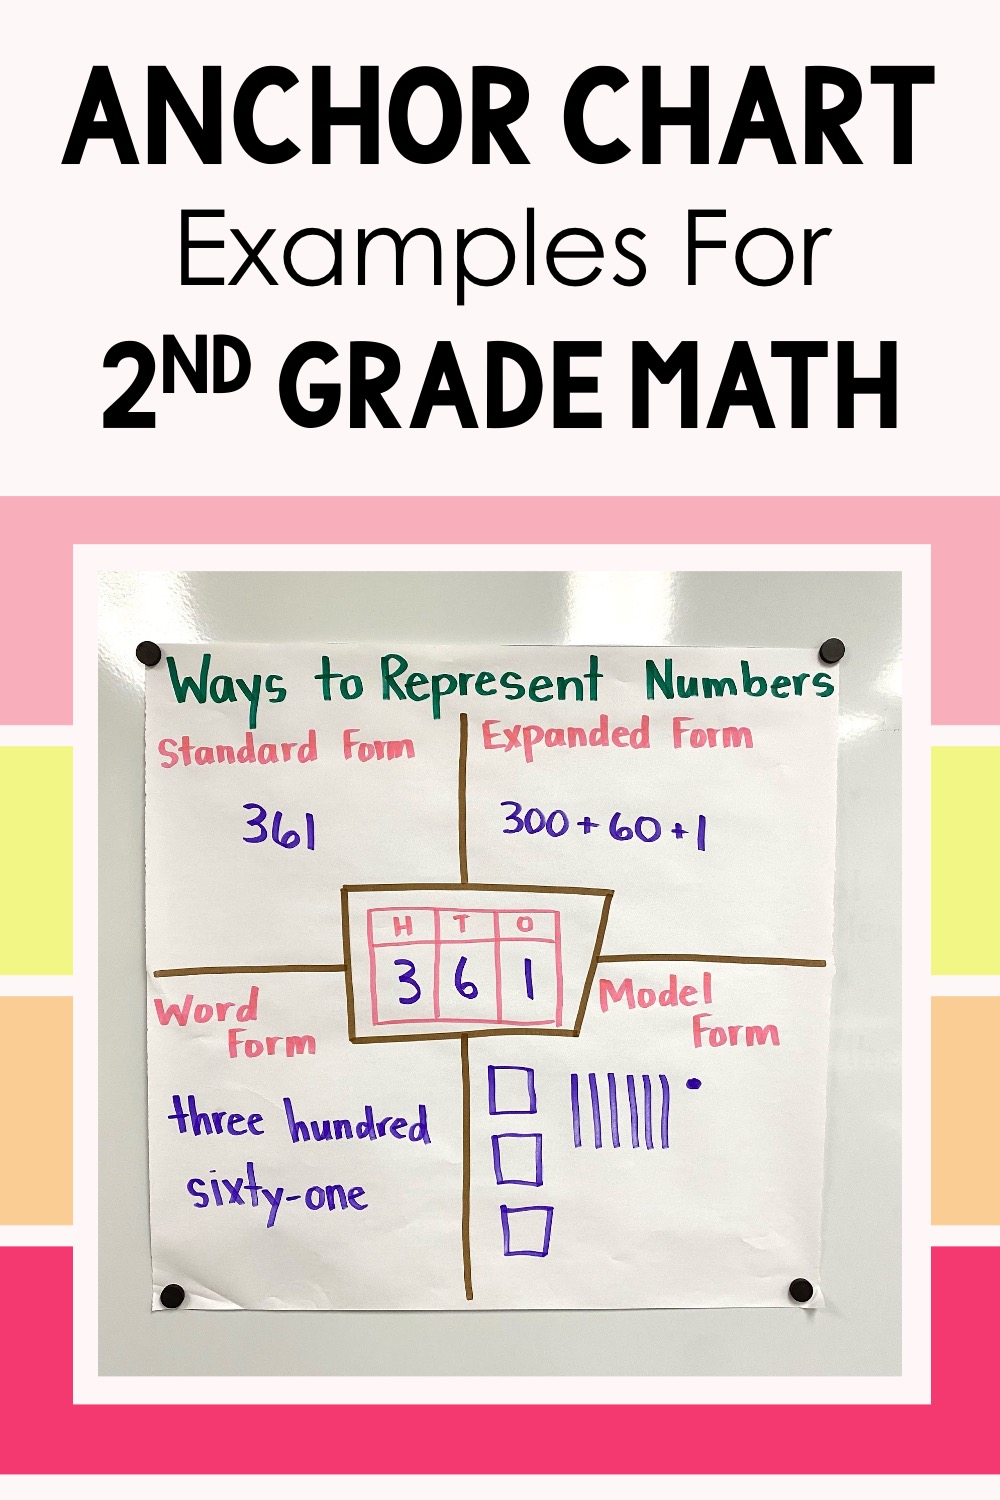
This is one of the most helpful anchor chart examples I use with my 2nd grade students.
I ask students to give me a random 3-digit number. Then I ask how many hundreds, tens, and ones are in the number. We put those in the hundreds, tens, and ones chart in the middle of the anchor chart.
Then I tell students what the standard form of the number is. We write that in that section. After that we do the same for the expanded form, word form, and model.
I then want students to get their own practice with this concept. So I have them make their own anchor chart. I have printable student anchor charts that have all the outlines. Students get one of those pages, pick a 3-digit number, and fill out the mini chart. It’s so engaging. They love it!
Want to use these student anchor charts with your class? Find them here.
Another anchor chart that I use for direct instruction helps students be flexible with 3-digit numbers. I split the chart into 3 different sections. Then I label the first section “Way 1: Expanded Form.” The other 2 sections are labeled “Way 2” and “Way 3.” I also draw an outline of a hundreds, tens, and ones chart in each of the sections. Then the outline is ready for our lesson. Remember I copy this outline from my printable anchor charts. Find them here.
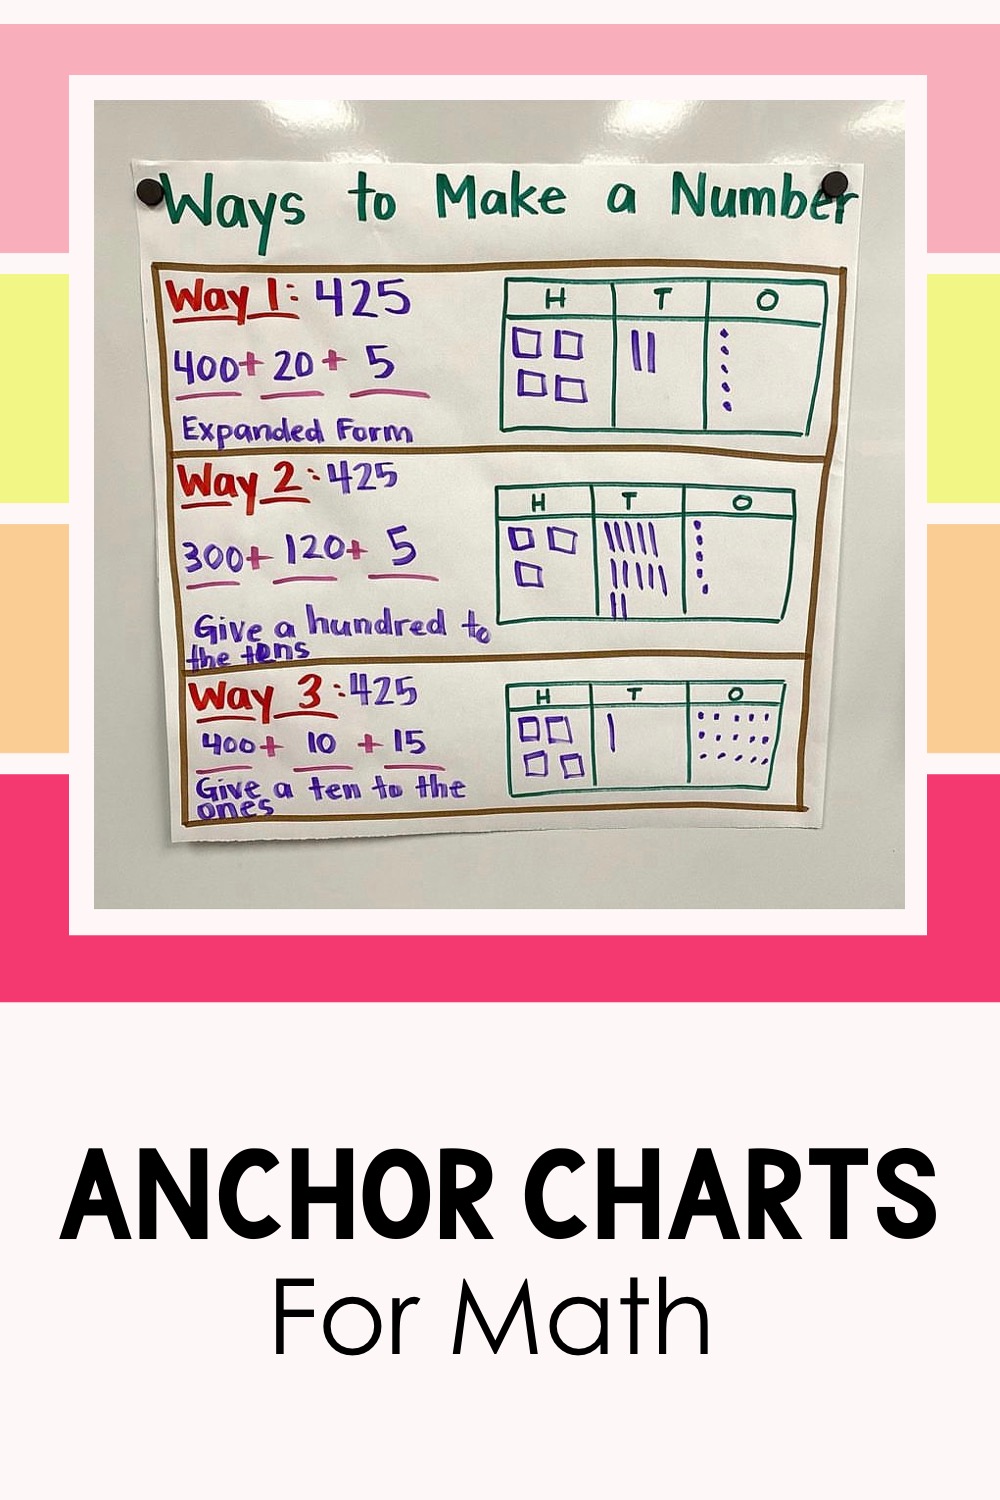
Anchor charts for math can build deeper understanding and allow students to refer back to when they need extra help.
For the lesson, I have students give me a random 3-digit number. I ask students what the expanded form is for that number. Then I write that out. After that, I have students help me draw the hundreds blocks, tens rods, and ones blocks in the hundreds, tens, and ones chart as a way to visually represent the number.
Then we go onto Way 2. For this way I share with students that we can give 100 to our tens number in our expanded form number and it still makes the same number. I write out the equation and we draw it in the hundreds, tens, and ones chart to show that it really does make the same number. Also, I write in this section, “give a hundred to the tens.”
Then we move onto Way 3. I show students how we can move a ten to our ones number from our original expanded form. Then we draw the models in the hundreds, tens, and ones chart to discover that it really does make the same number.
After that, it’s time to get students their own practice. I print out the student versions for them. They choose a 3-digit number and show it with Way 1, Way 2, and Way 3.
Learn my full place value lessons in this blog post here.
Another great topic to use anchor charts for direct instruction is shapes. Like the other charts I’ve shared, I get the outline ready beforehand. For this chart, I put “Shapes” in the middle. Then I split it into 4 sections and label them triangles, quadrilaterals, pentagons, and hexagons. I also put “sides, angles, and vertices” in each section with blanks right before them. Then I cut out a bunch of shapes from colorful construction paper.
For the lesson, I teach students how many sides, vertices, and angles each shape has. Then I show the shapes I cut out to students. They help me sort the shapes and we glue them up on the chart. This makes the chart really colorful and interactive. I love how this chart outlines the principle that shapes have the same number of sides, angles, and vertices.
After that, I get my students their own practice. I give them the student version of the anchor chart and they fill in how many sides, angles, and vertices each shape has. They also draw examples of each shape on their chart. Find these student versions here. Learn my full shapes lesson in this blog post here.
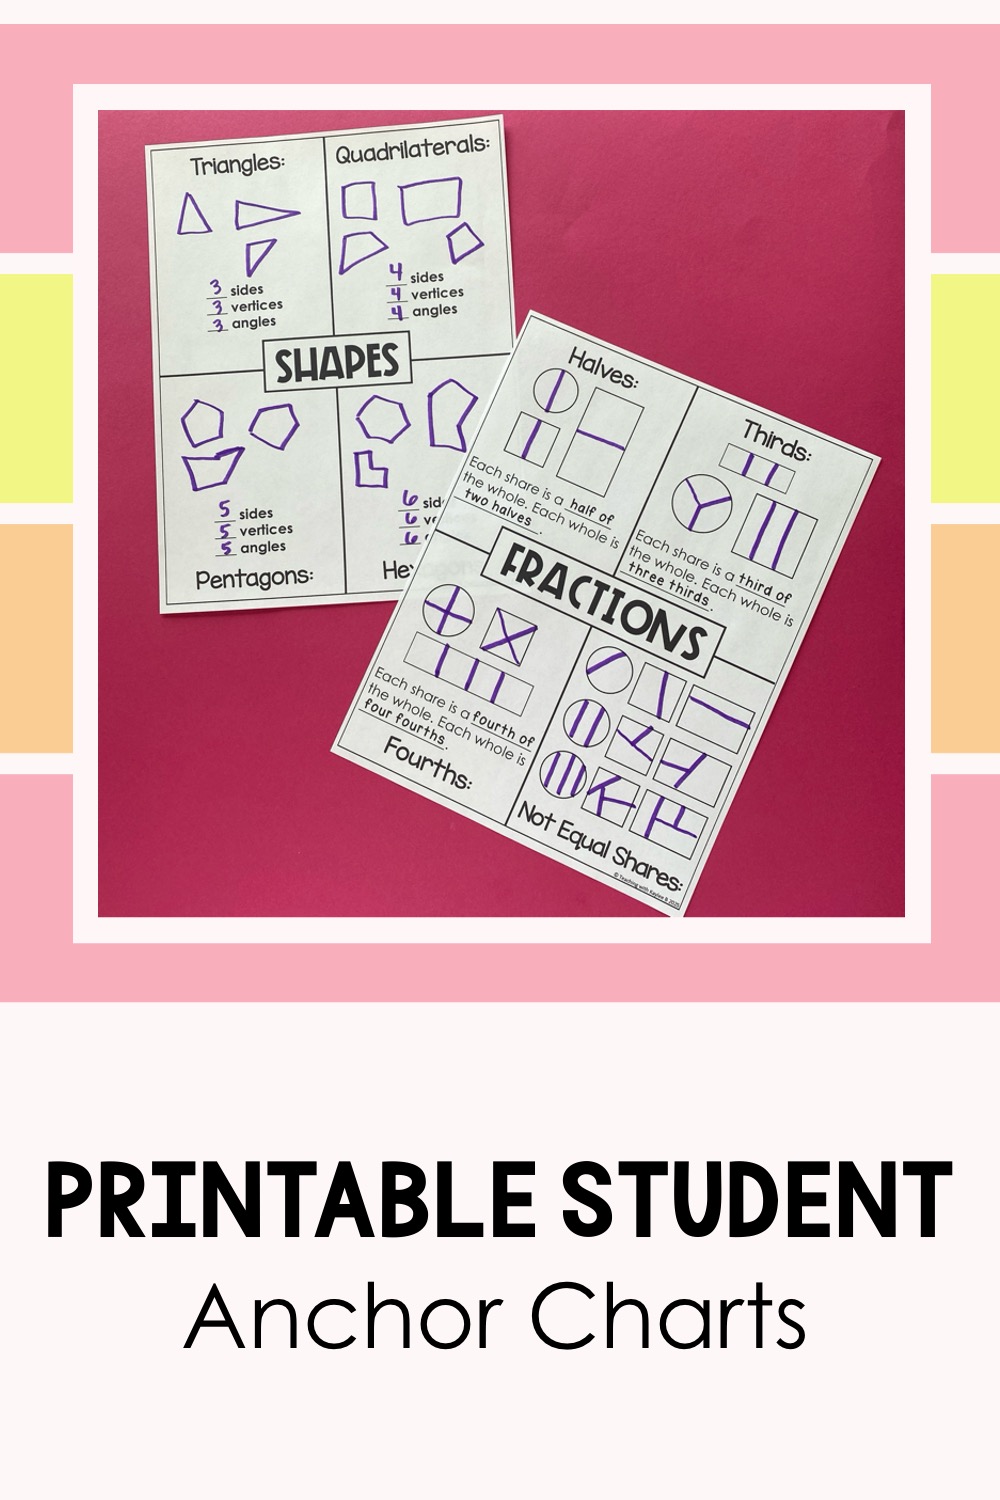
Use the student version of printable anchor charts to get extra practice with the math concepts.
I also have a similar math anchor chart for fractions. In the middle of the chart, I write the word fractions. I split the page into 4 sections and label them halves, thirds, fourths, and not equal shares. Then I draw the outlines of a circle, square, and rectangle in each section. After that, students help me split the shapes so that they make halves, thirds, and fourths. We talk about how if they are not split into equal shares, then they are not fractions. Students help me show some examples of this in the “Not Equal Shares” section. Again, it’s so nice to be able to just copy this on big chart paper by looking at the outline. Find my printable anchor charts here.
Have you guessed the routine by now? It’s now time to give students their own practice. I give them the student version and I challenge them to split the shapes in different ways then the ways shown on our class anchor chart.
Using anchor charts helps to enhance your direct instruction, but I also like to use anchor charts as a review of the different strategy lessons.
Math Strategies Anchor Charts 2nd Grade
A big focus in 2nd grade math are different math strategies. Students learn lots of different math fact strategies and different strategies for 2-digit and 3-digit addition and subtraction. During these units, you usually teach a new strategy each day. After teaching all the strategies for the unit, I like to have a review lesson over all of them. To review, I make math strategies anchor charts 2nd grade students find really beneficial.
Let me give you an example with 3-digit addition strategies. In the middle of the chart I write “3-Digit Addition Strategies.” Then I split it up into four sections and label them open number line, mental math, partial sums, and regrouping.
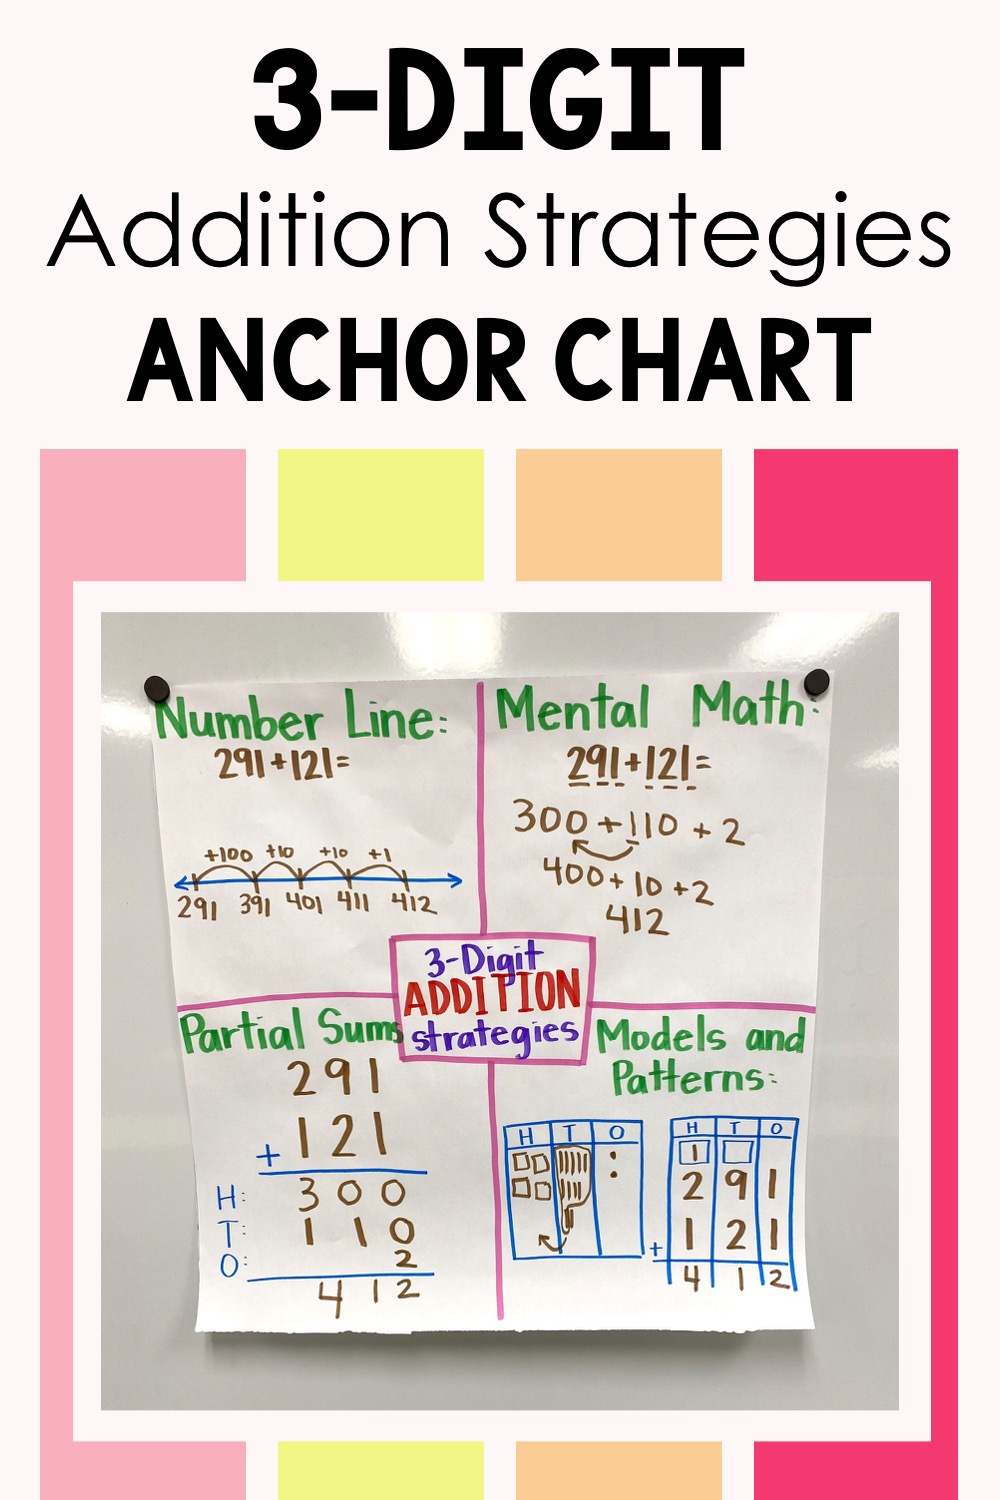
This math strategies anchor chart helps me review each 3-digit addition strategy with my 2nd grade students.
Then as our math warm-up for the day, I’ll give students an equation and then they walk me through how to solve it using the strategy. I record what they tell me to do on the chart. By making the chart together, we are reviewing each strategy.
Then I have students make their own version of the chart with the student version. Students choose their own equations to show how to solve using each strategy.
For the rest of the lesson, I give students different equations and they solve using any strategy they want. It’s helpful to display our large anchor chart on the front whiteboard for students. They can refer to it to help them choose a strategy to solve. Learn about each 3-digit addition strategy I teach my 2nd grade students in this blog post here.
Math Vocabulary Anchor Charts
I often get asked if I use anchor charts to teach math vocabulary. And although I know my anchor charts do bring in understanding of the different 2nd grade math terms, I like to explicitly teach each math vocabulary word to students.
To easily do this, I use Math Vocabulary Cards. These are kind of like anchor charts. They show the word, the definition, and they show pictures and examples. After I teach the word, I hang these up for students to refer to when needed.
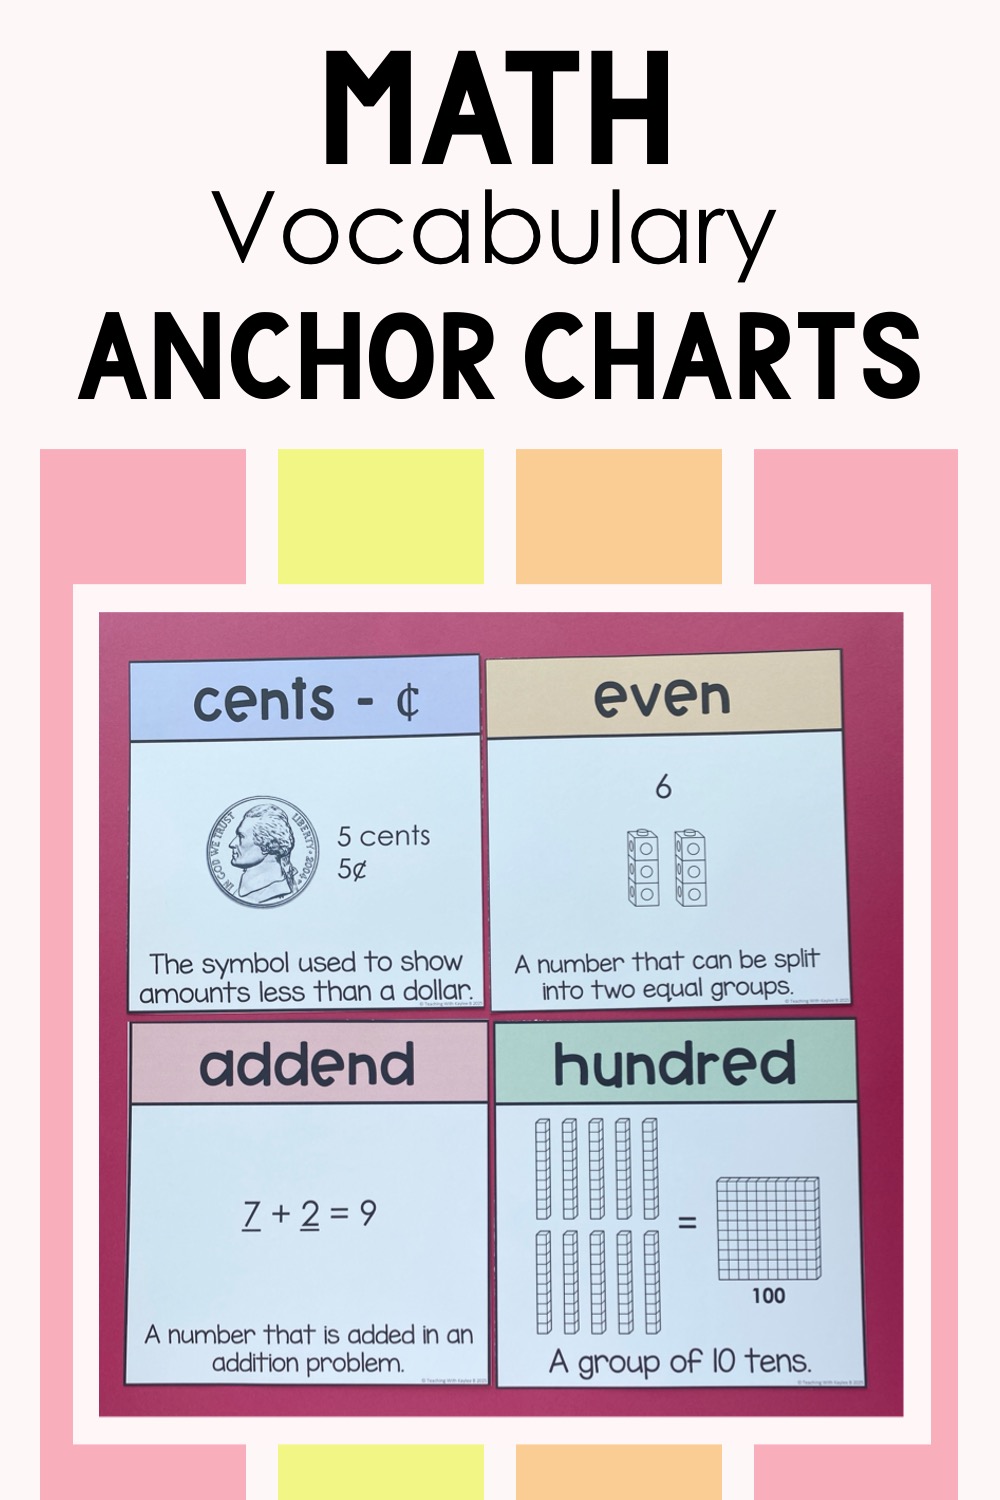
Math vocabulary anchor charts provide a visual reference that supports students as they learn new math concepts.
They pair really nicely with my math anchor charts. Find my Math Vocabulary Cards here. Learn more about how to use them in your classroom in this blog post here.
I hope this blog post has given you more confidence in using math anchor charts to help make your 2nd grade math instruction more effective. It comes down to making the charts with your students. They can be used for direct instruction or review lessons. Plus, when you make them with your students, they are more likely to refer to them when they need help. And when students make their own charts, they engage in guided practice in a way that strengthens their understanding. This turns anchor charts into a powerful learning tool.
Key Takeaways for Using Math Anchor Charts Effectively:
- Make them with your students so they feel invested and use them as a reference.
- Use them for direct instruction by modeling concepts in real time.
- Incorporate student versions to encourage hands-on learning.
- Display them in an accessible spot so students can refer to them easily.
- Use anchor charts to review strategies for different math strategies
Ready to use anchor charts in your math lessons? Find the 2nd Grade Math Anchor Charts I use here.
Make math anchor charts a seamless part of your instruction! With 52 ready-to-use printable anchor charts and student versions, you’ll save time while making math more interactive and engaging. Click here to grab your set and start transforming your math lessons today!
