Picture graphs are so fun to teach in 2nd grade because they bring in real world math. You can gather different data from the class and make picture graphs together. From there you can ask students about the data in the graph to draw conclusions.
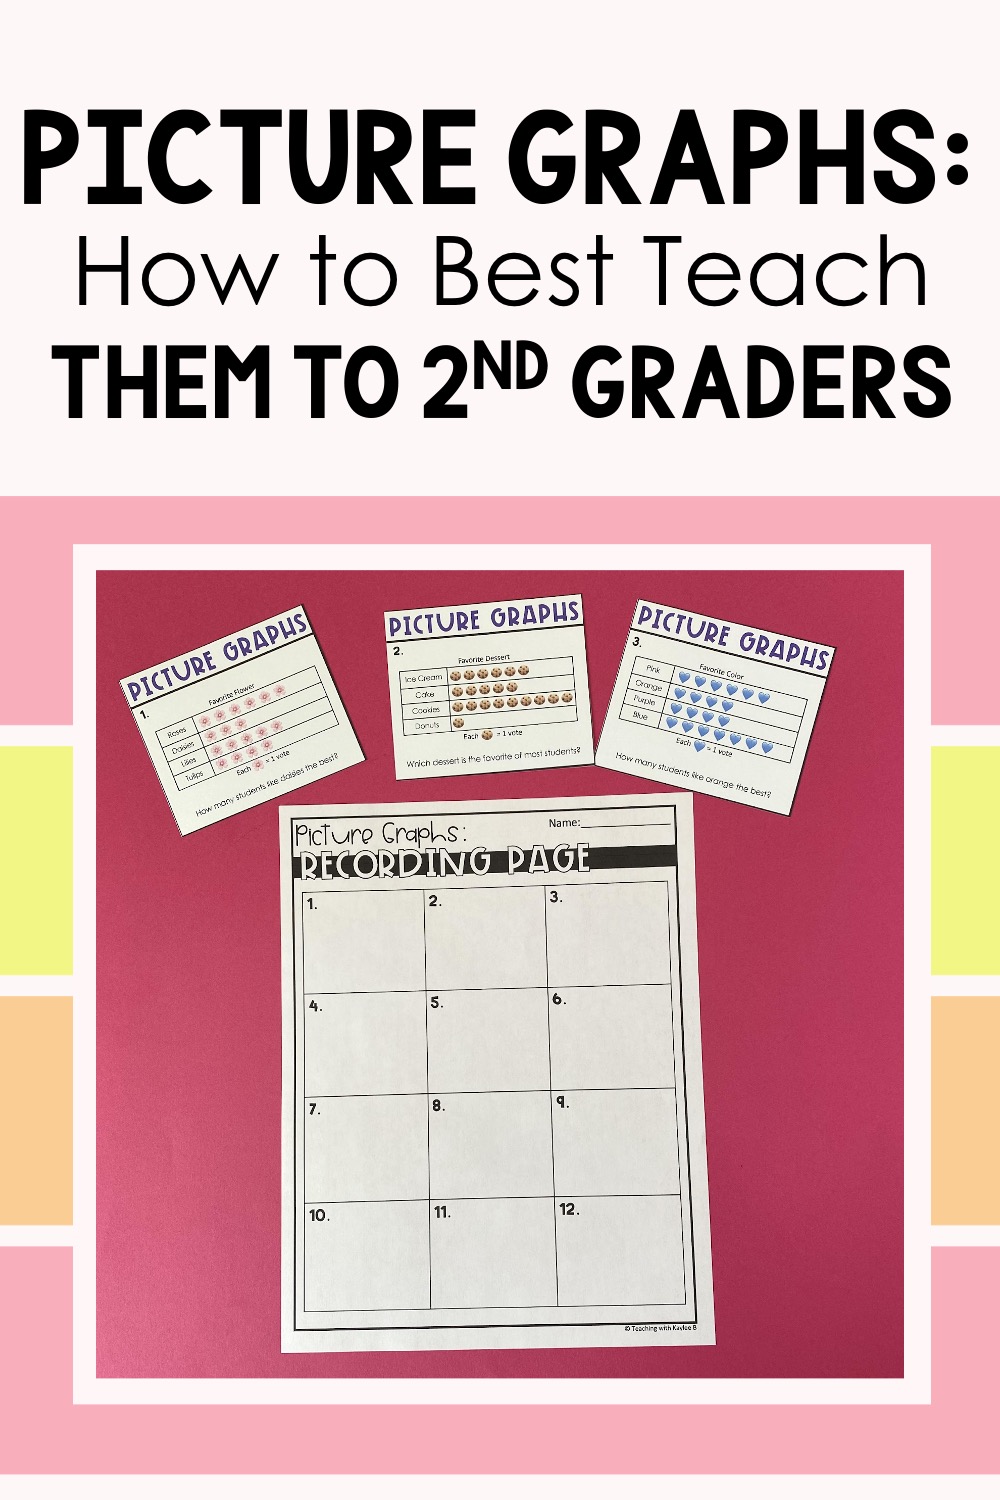
Learn my method for teaching picture graphs here in this blog post.
Students love drawing picture graphs because they get to draw pictures to represent the data.
Making a graph about favorite food? You can draw little pizzas for the data. Collecting data from the week’s weather? You can draw little suns for that. Collecting data on classmates’ favorite color? You can draw hearts for that. Students love being creative on what to draw for picture graphs.
The 2nd grade Common Core State Standard for picture graphs says, “Draw a picture graph and bar graph (with single-unit scale) to represent a data set with up to four categories. Solve simple put-together, take-apart, and compare problems using information presented in a bar graph.”
Did you catch that? Students will solve problems with bar graphs, not picture graphs. Our lessons will focus on students drawing picture graphs and answering simple questions about the data shown. For how to teach problem solving with bar graphs, read this blog post here.
So to help you teach picture graphs, let’s get into what is a picture graph in math, picture graph examples for students, and picture graph worksheets you can have students do to master this data and graphing standard.
What is a Picture Graph in Math
When it comes to what is a picture graph in math, a simple way to put it is that it’s a graph that uses pictures or symbols. Each picture stands for a certain number of things. You can count the pictures easily to see how many are in each category.
It’s almost like a bar graph, but instead of a bar to show how many, there are pictures. Bar graphs usually have numbers along one of the edges of the graph, picture graphs do not. They do have a key to show how many each picture represents.
From picture graphs, students can see how many are in each category. They can easily see which category has the most and which one has the least. They can also count up how many there are in all.
When teaching about these graphs, I like to use plenty of picture graph examples for students.
Picture Graph Examples For Students
I like to show these examples with display pages. They are like slides that I display up on our whiteboard. The first graph I show students is about favorite food. I point out the title, the categories, the key, and of course the pictures.
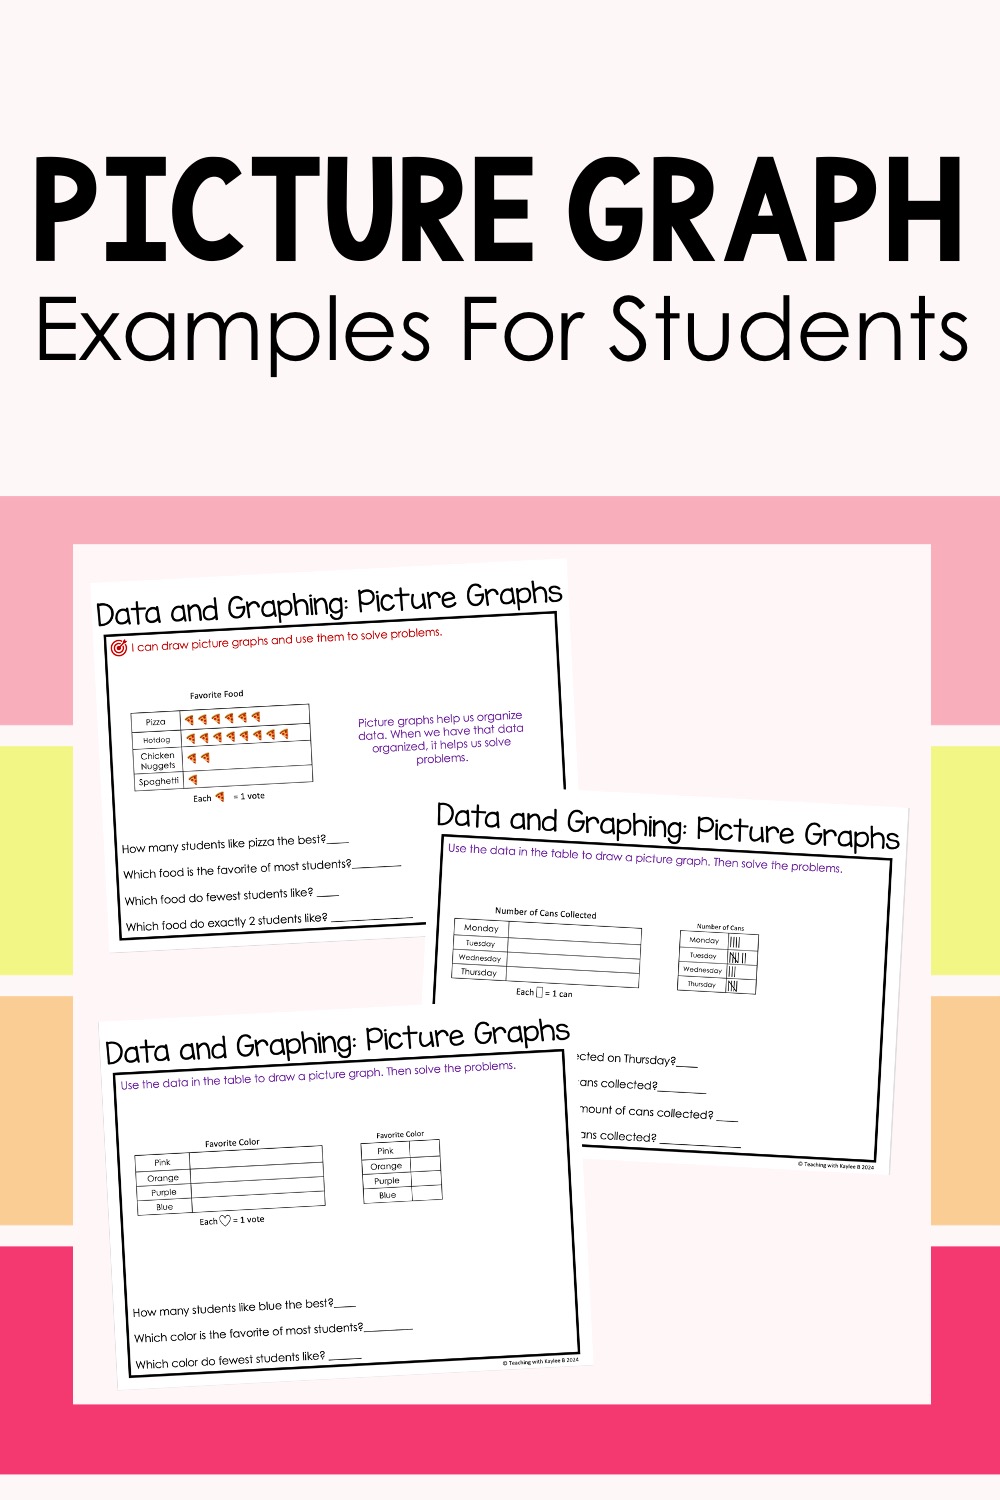
These picture graph examples for students help students learn what picture graphs are.
In this graph, each pizza emoji means one vote. So if there are 6 emojis in the pizza category, then that means 6 people said that pizza was their favorite food. To go with this picture graph example, I ask students questions like which food is the favorite of most students and which food do exactly 2 students like.
Then I show students another picture graph example. This time it’s just an outline of a picture graph. We practice drawing the graph together. This graph is about the number of cans collected and categories are the days of the week. There is a tally chart that gives us the data on how many cans are collected. This example also gives us a key. One rectangle represents one can collected.
I ask students how many cans were collected on Monday. They look at the tally chart and see that there are 4 tally marks. So how many cans should I draw for Monday? 4. We do the same for the rest of the days of the week. Then I ask students a few questions about the data. These questions include how many cans were collected on Tuesday and which day were the least amount of cans collected.
It’s great drawing a graph together, but now I want to show students how we can collect our own data and draw a picture graph for it. Again, our display page has an outline of a picture graph. It has the title of “Favorite Color.” The categories are pink, orange, purple, and blue. It shows the key that a heart represents one vote. There is also an outline of a tally chart. I have students raise their hands for their favorite color and I record the data using tally marks. Then we take that information and draw hearts to complete the picture graph.
After that, I ask students questions about the data. These are questions like which color is the favorite of most students and how many students like blue best.
Now that I have shown plenty of picture graph examples for students, it’s time to get them their own practice with picture graph worksheets.
Picture Graph Worksheets
I like to scaffold the practice I give students, so I start out by having them complete a picture graph worksheet that has the picture graph already filled out. They just answer questions about the graphs.
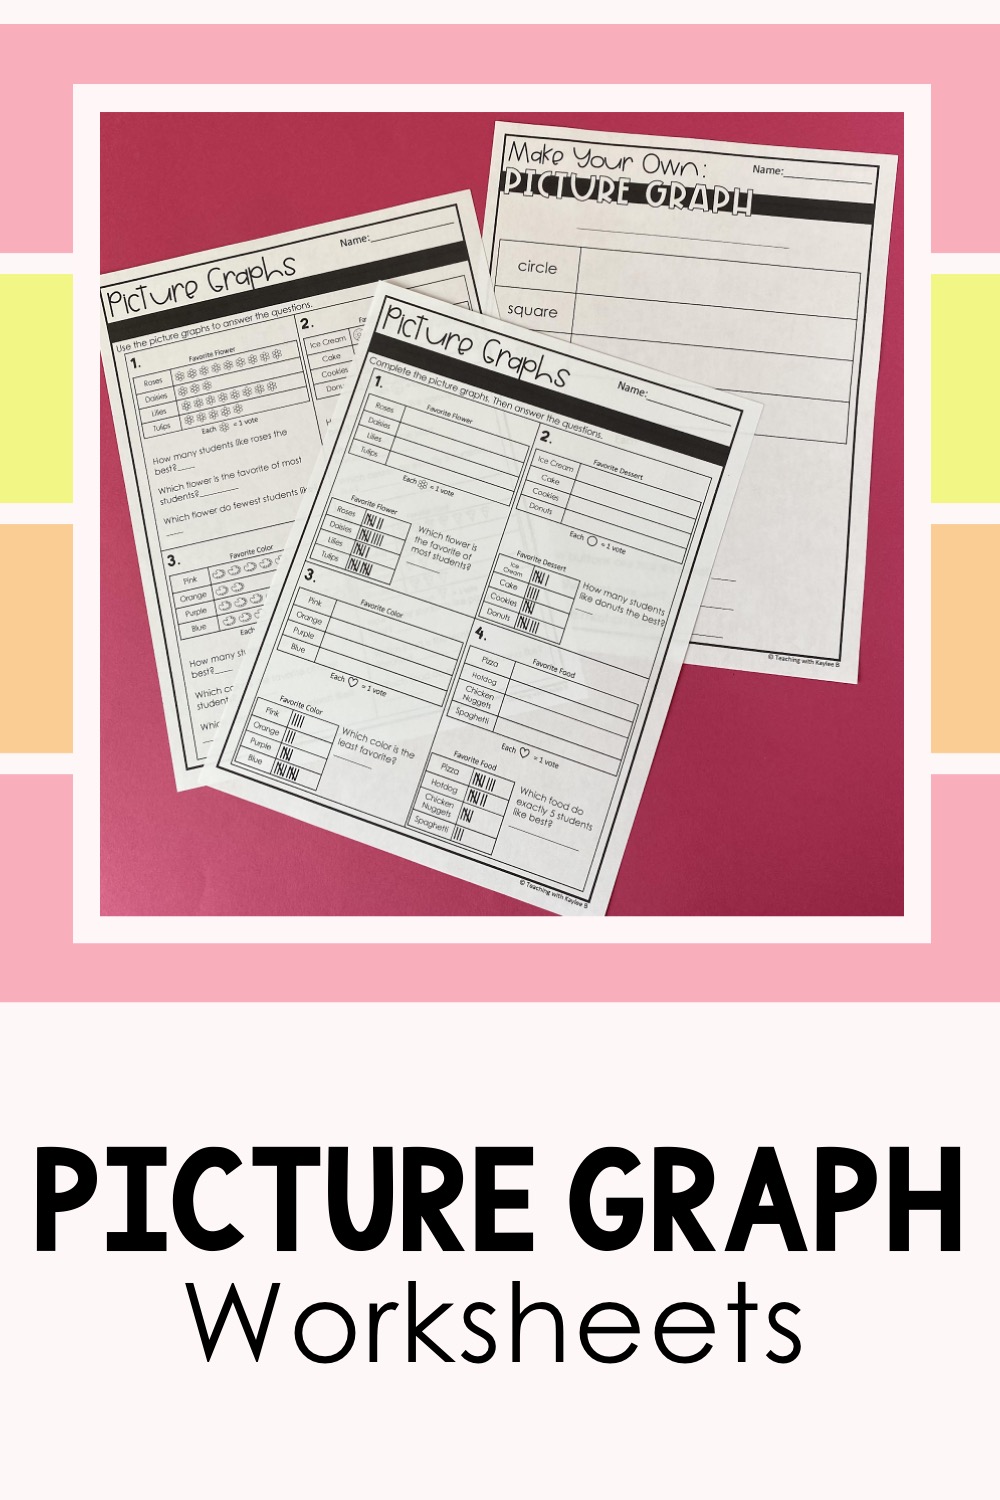
These picture graph worksheets get students the hands-on practice they need to master picture graphs.
Then I give them picture graph worksheets that just have the outline of the picture graph. There is a tally chart with the data and they have to represent the data in the picture graph. They love drawing the pictures. These worksheets still have them answer a question for the graph. The graphs included topics of favorite flowers, favorite desserts, favorite color, favorite food, vegetable plants in a garden, color of buttons, and dollar bills in a wallet. Students love the real world aspect of these. Find the scaffolded worksheets I use here.
I also like to get students up and moving as part of their practice. So, I have them complete a picture graph scoot activity. This is where I have task cards with different picture graphs taped up around the classroom.
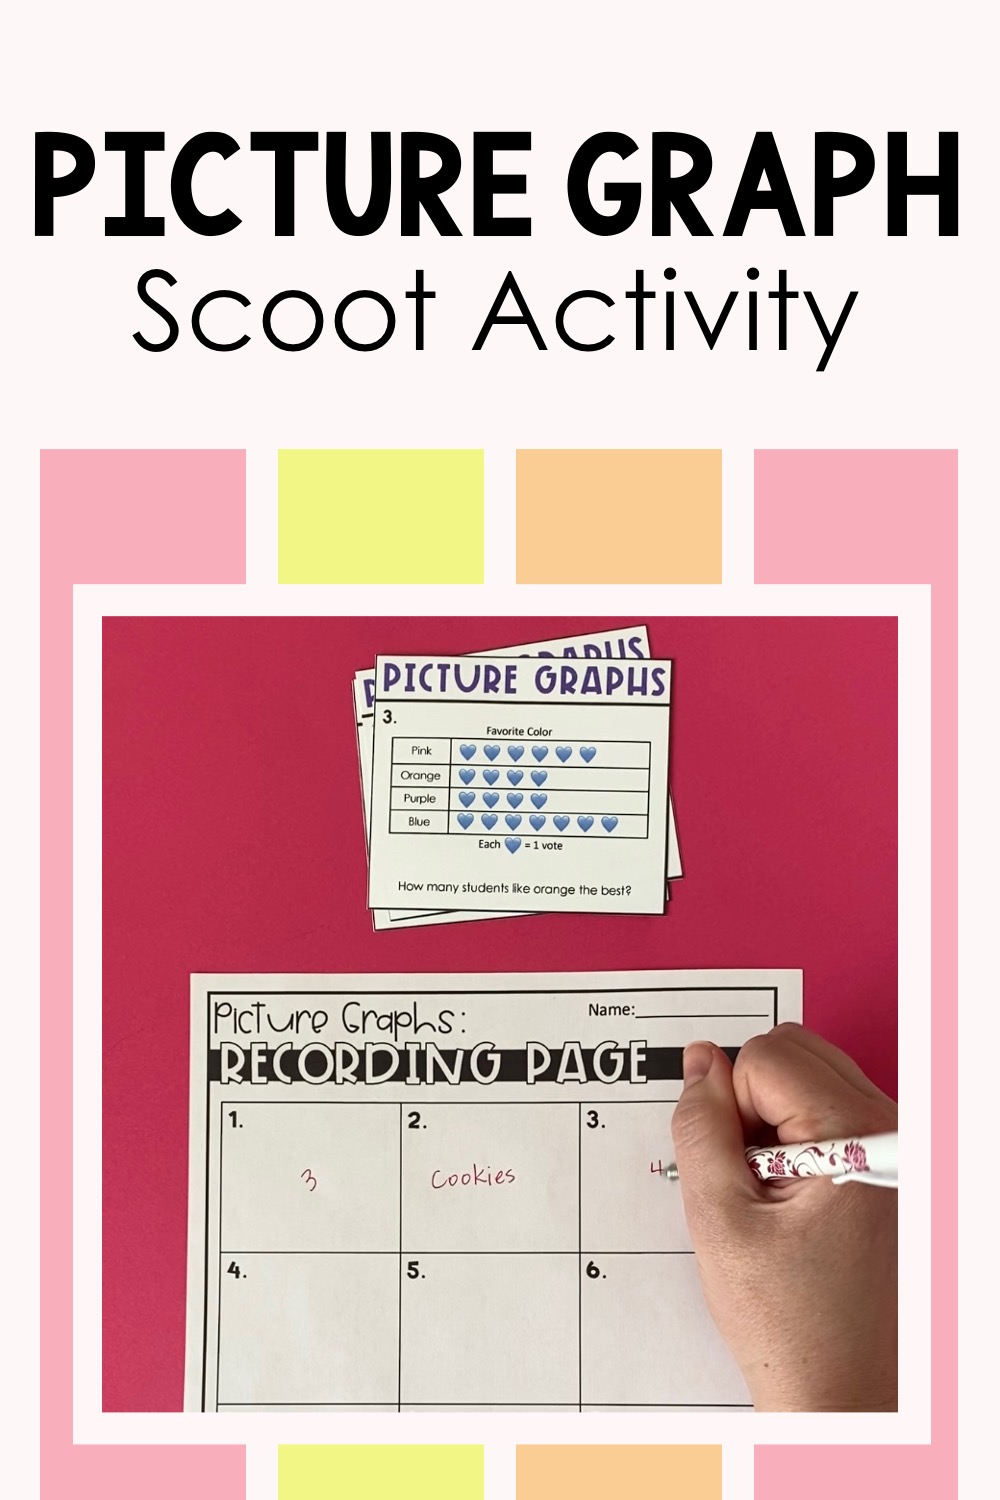
As part of my picture graph lesson, I have students complete this picture graph scoot activity with a partner.
I pair students up with a partner and they take their recording sheet to each picture graph. They analyze the graph and answer the question that is on the task card. I love how this gets students talking about the math together. As I go around, I hear students say things like “Oh! I can see cookies got the most votes” or “We need to count how many cows there are!”
Once students are finished with that, I have them check their work with an answer key I have set out. This gives students immediate feedback and saves me time. No correcting papers after school! Find this scoot activity here.
Then I have students make their own picture graph. They love this project! You can give them complete free range on a topic they want. They collect the data and draw the picture graph. Students even write a couple questions about the data and answer them. Students get really creative!
If you don’t want the chaos that can come from students choosing different topics, you can have students make a picture graph on button shapes. Maybe you have buttons in your classroom and can give each student a handful. Or I have sheets with clipart with different buttons. Students count up each shape and make their own picture graph.
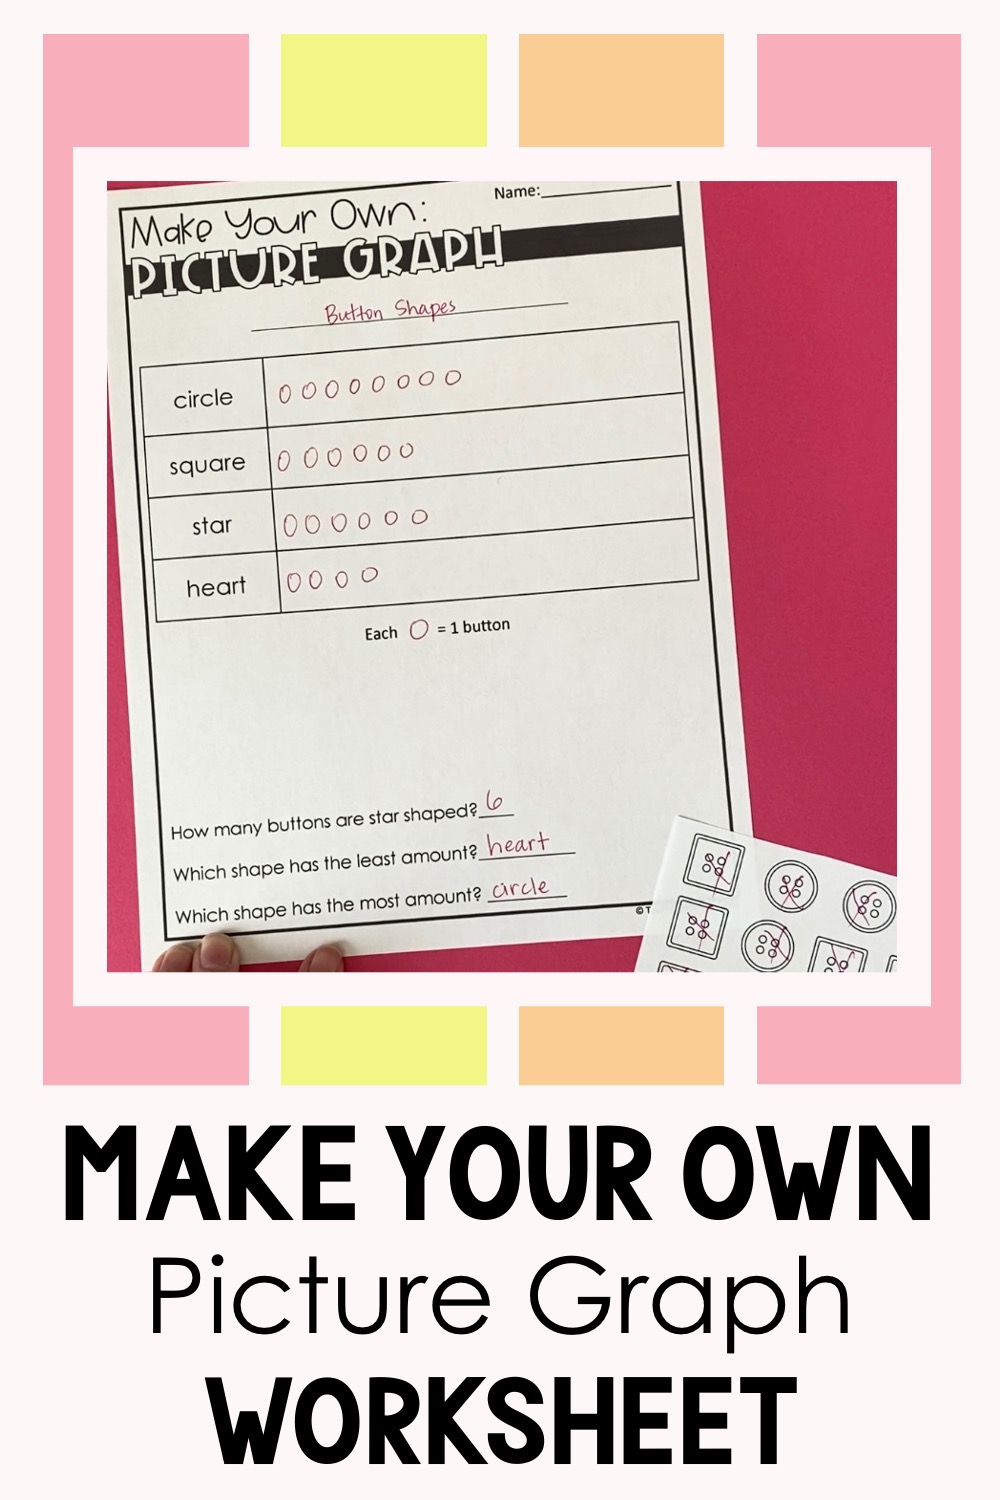
Help students draw their own picture graphs with this Make Your Own Picture Graph Worksheet.
Then I like to get students into small groups and have them share their picture graphs with a few classmates. Find these Make Your Own Picture Graph projects here.
I hope this blog post has been helpful when teaching picture graphs to your 2nd grade students. When it comes to how to teach picture graphs, I like to first tell students what is a picture graph in math. Then I show plenty of picture graph examples. And finally, I have students get their own practice with engaging picture graph worksheets.
Picture graphs are not the only graphs we teach in 2nd grade. We also teach line plots and bar graphs. Learn about how to best teach line plots here and bar graphs here.
I have all of my data and graphing resources together in one bundle to save you time and money. Everything you need is all in one place! Find it here.
